7 Bootstrap Charts and Graphs
This collection integrates powerful visualization libraries like Chart.js and ApexCharts into Bootstrap’s responsive ecosystem. By leveraging the grid system and Cards, graphs automatically resize to fit any viewport, while SCSS variables ensure a unified color palette and Dark Mode support. Special attention is given to technical solutions for rendering within dynamic components (modals, tabs), preventing layout glitches when visibility changes. It is a ready-to-use kit for building professional, visually consistent dashboards.
Examples
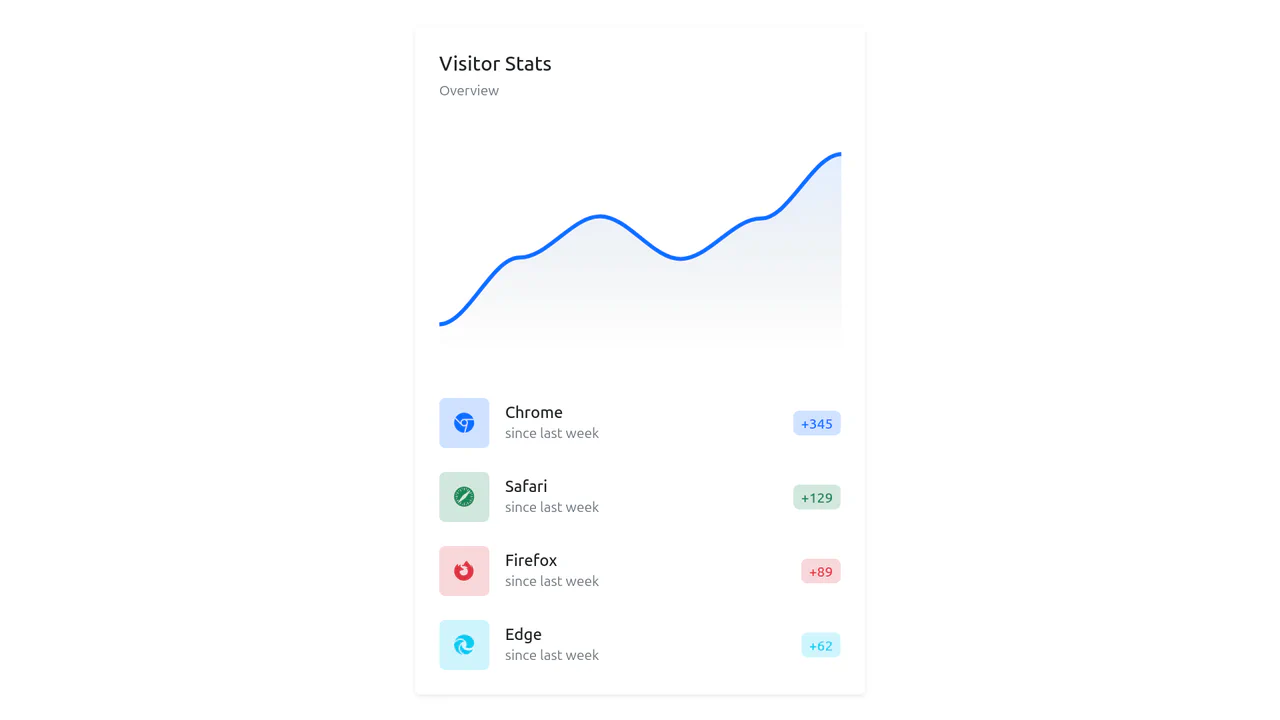
A compact and clear analytics block where color coding links abstract chart arcs to specific browsers in the legend, ensuring quick data readability.
A clean, isolated analytics block ready for integration into any dashboard, featuring responsive behavior thanks to the Bootstrap grid.
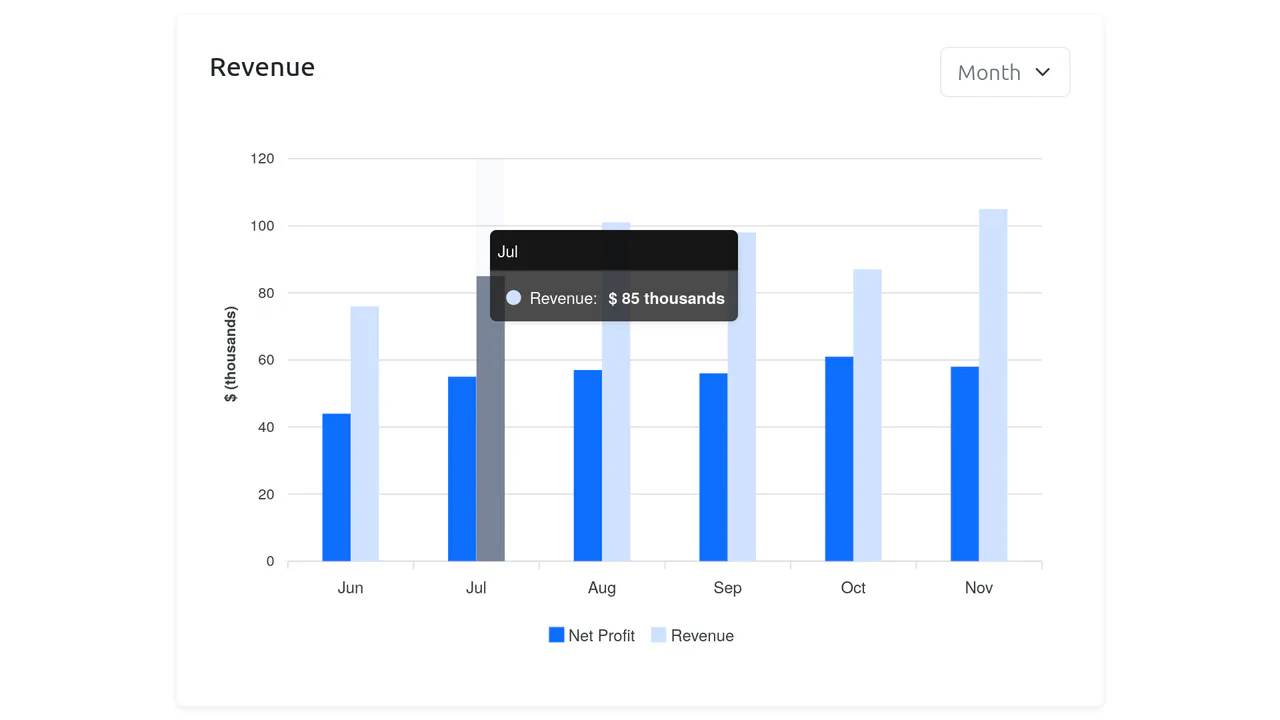
A responsive revenue analytics widget built with Bootstrap 5 and ApexCharts. It features a flexible header layout with a time-period dropdown selector, while the core chart rendering is handled dynamically via JavaScript injection into the #bsb-chart-5 container.
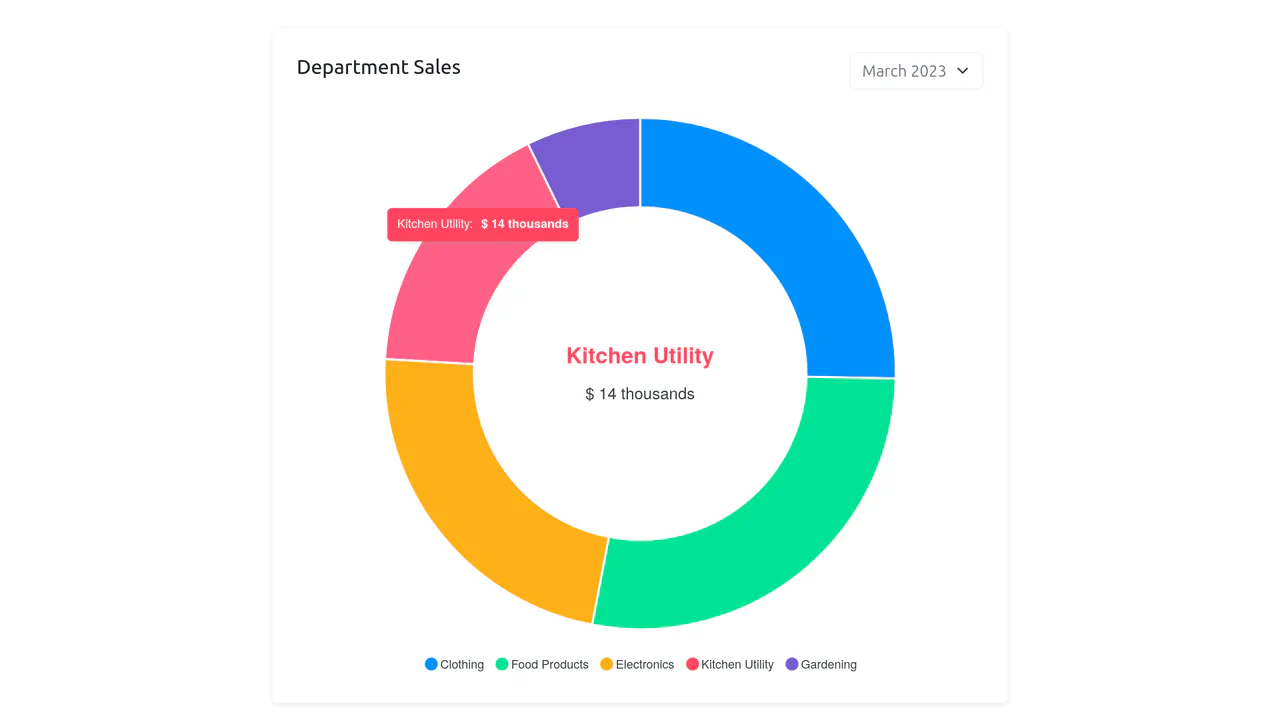
A responsive department sales widget combining Bootstrap 5 layout utilities with ApexCharts visualization.

An informative and visually consistent statistics block where the chart’s color scheme is clearly mirrored in the legend, simplifying data perception for the user.
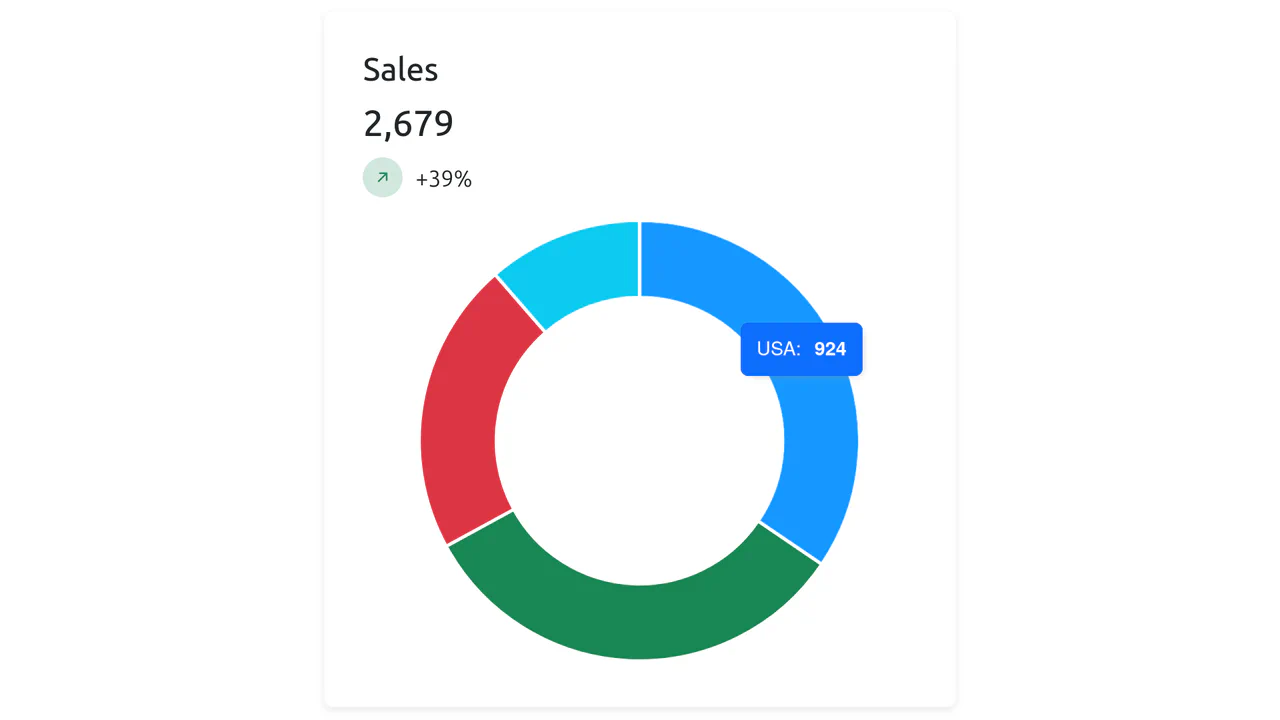
A compact sales KPI card built with Bootstrap 5, featuring a prominent metric display and a trend indicator.

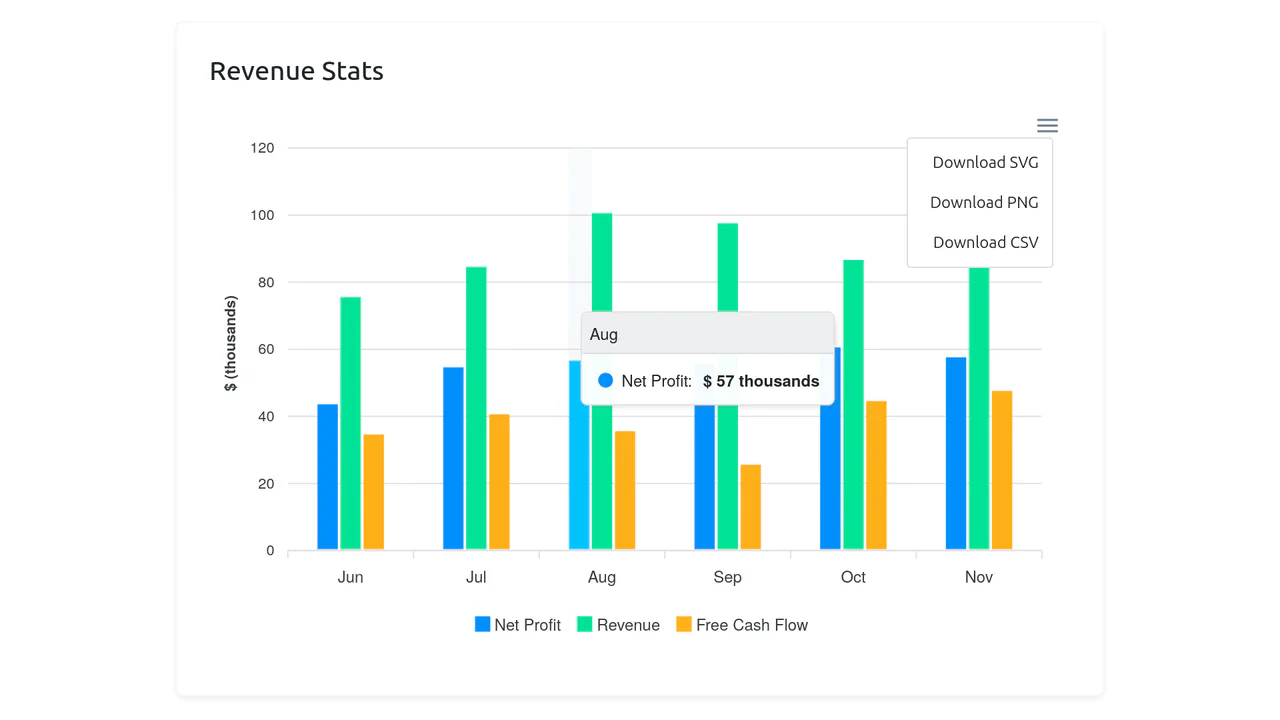
A sales analytics widget built on Bootstrap 5 cards, utilizing the ApexCharts library for data visualization. The layout features a responsive header with a date selector, while the core chart rendering is handled dynamically via JavaScript injection into the #bsb-chart-1 container.