7 chart.js Examples
Visualize your data with ease using Chart.js. This collection showcases a variety of responsive and customizable chart examples - including bar, line, pie, and radar charts - all built with the powerful and lightweight JavaScript library.
Examples
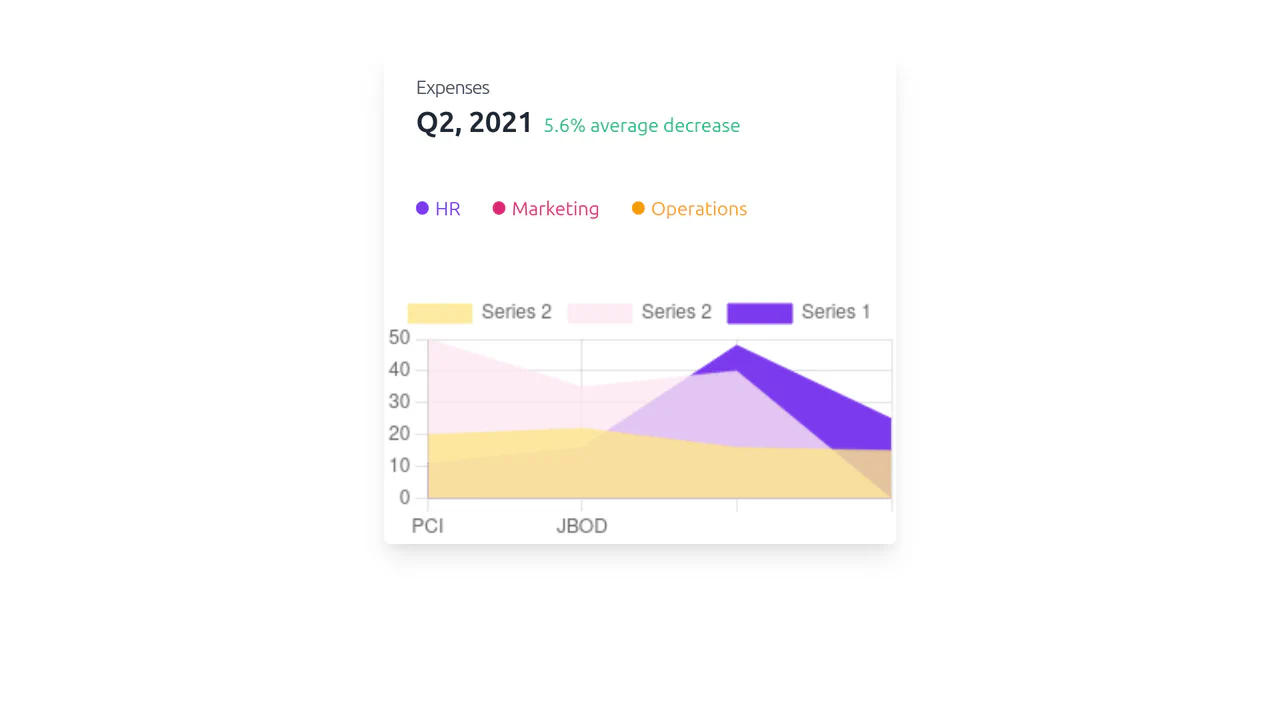
Card Graph with Tailwind
A compact dashboard widget featuring a stacked area chart rendered by Chart.js to visualize expenses across different departments. Styled with Tailwind CSS, the card includes a custom legend and a clean header.
See the Pen Card Graph with Tailwind.

Free Tailwind CSS Graph Component
A sales overview dashboard widget featuring a line graph rendered by the Chart.js library. It includes interactive controls like toggle buttons and a dropdown for data filtering, all styled with Tailwind CSS.
See the Pen Free Tailwind CSS Graph Component.

Glassy AI Agents SaaS Interactive Dashboard
A cutting-edge, glassmorphic dashboard for AI agent monitoring, built with Tailwind CSS and Chart.js. It features a hash-based SPA architecture, real-time data simulation with live chart updates, and a dynamic theme switcher (light/dark mode).
See the Pen Glassy AI Agents SaaS Interactive Dashboard.
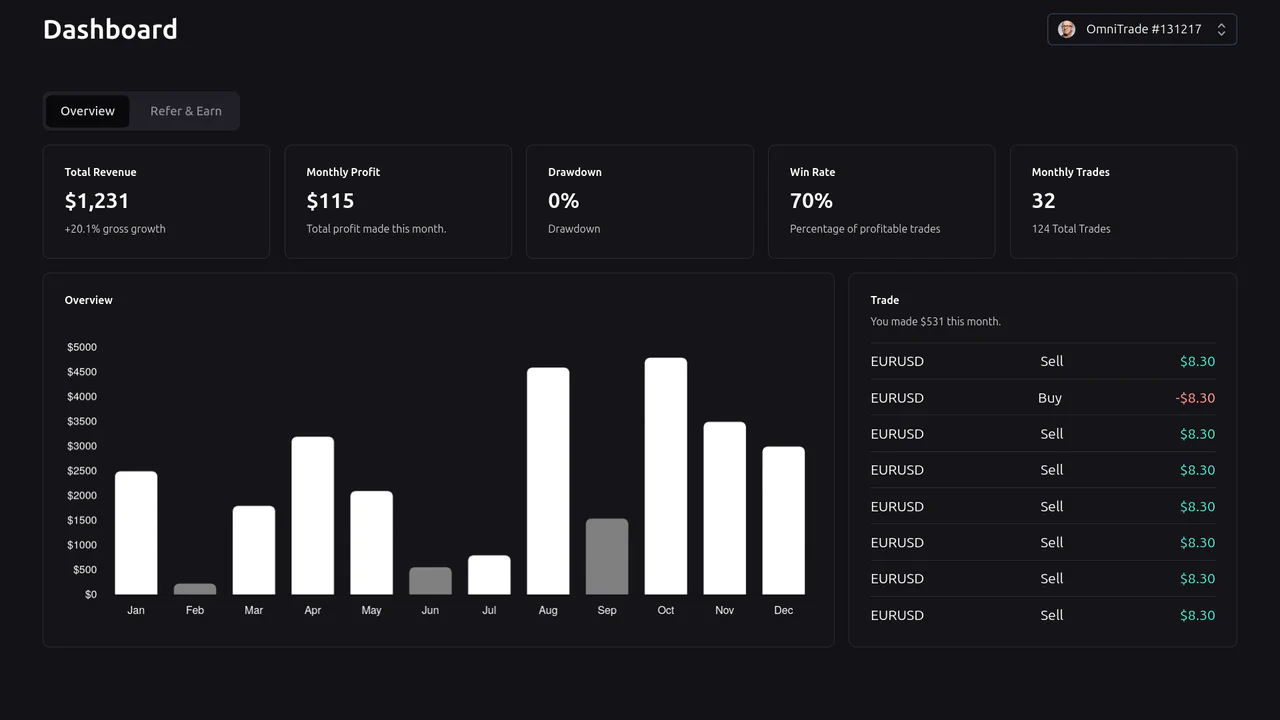
Tailwind Dashboard
A professional, clean, and high-contrast trader dashboard that effectively presents key metrics (revenue, profit, drawdown) and trade history.
See the Pen Tailwind Dashboard.
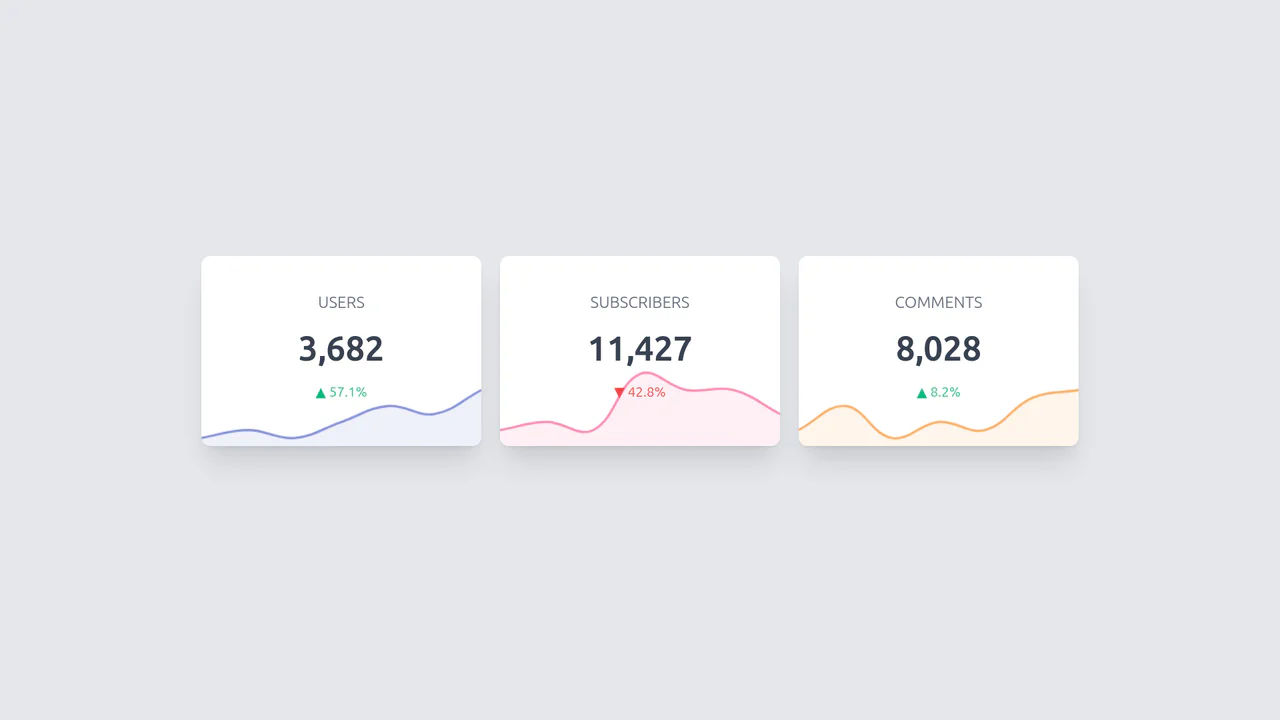
Tailwind Cards with Charts
Ready-to-use, responsive KPI cards built with Tailwind CSS. Each card integrates a dynamic mini-chart (sparkline), created using the Chart.js library, for clear visualization of key metrics.
See the Pen Tailwind Cards with Charts.

ChartJS Ping Animation Card
A sharp, stylized dashboard widget leveraging Chart.js to dynamically plot simulated live data, featuring the use of setInterval for continuous real-time updates and an animated numerical counter.
See the Pen ChartJS Ping Animation Card.
