30+ CSS Charts and Graphs
Data visualization often demands heavy dependencies. Pure CSS chart examples remove the weight of libraries like D3 or Chart.js, creating a direct path between metrics and the screen. This collection provides structural blocks for modern UI design. Visualizing simple statistics should not require significant bandwidth. Utilizing curated snippets ensures a transparent interface where logic dictates the form.
Technically, these examples rely on advanced background manipulation and layout engines. Pie charts utilize conic-gradient for precise radial values. Bar graphs leverage CSS Grid for alignment. Line segments use clip-path or transform: skew. No JavaScript. Hardware acceleration handles the rendering, ensuring 60fps performance and high layout stability. The HTML structure remains strictly semantic — often using <table> or <dl> — guaranteeing accessibility by default.
Every free demo is fully responsive and cross-browser compatible. Users can instantly download the raw code or fork a specific visualization on CodePen. These updated assets are strictly optimized for performance, delivering a fast, frictionless experience across all modern mobile and desktop devices.
Examples

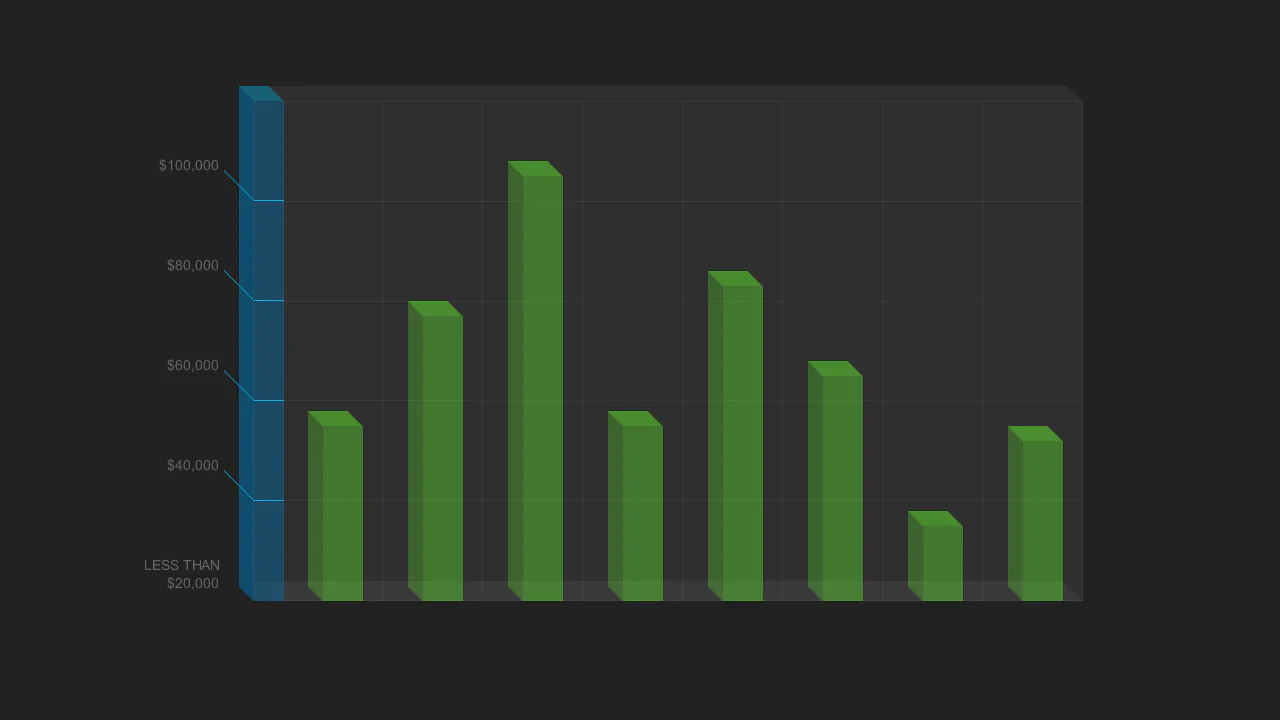
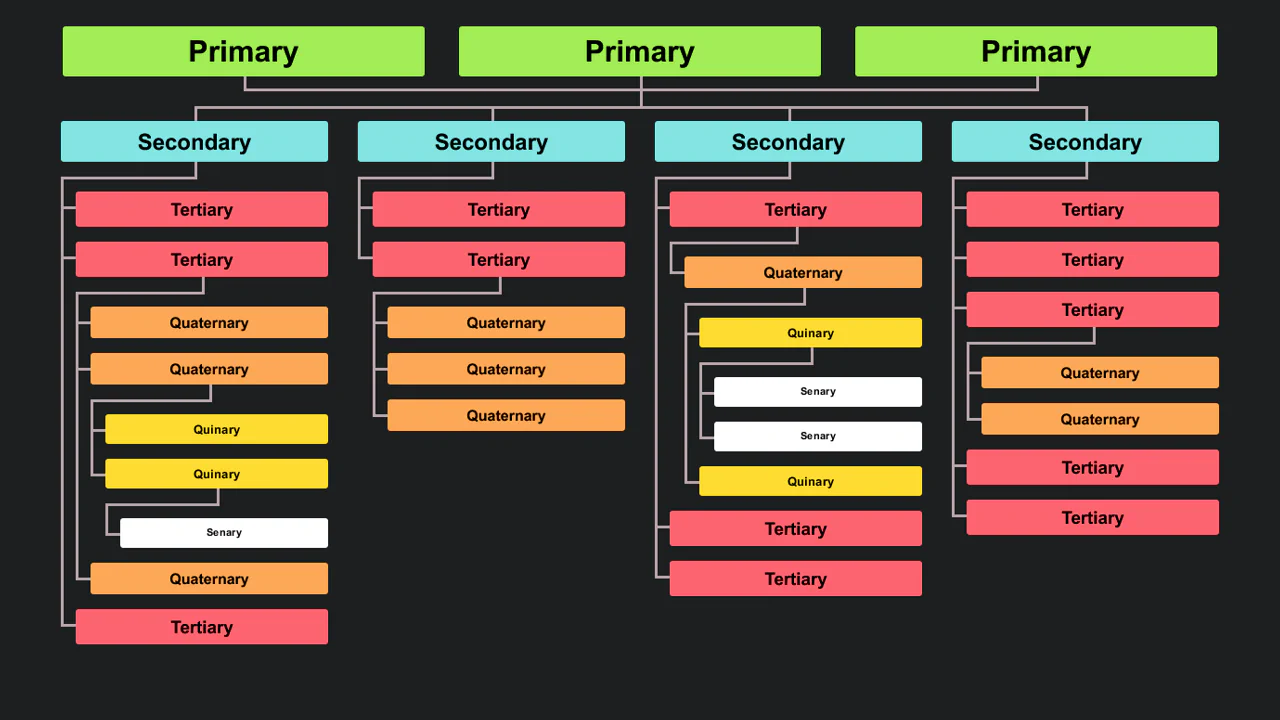
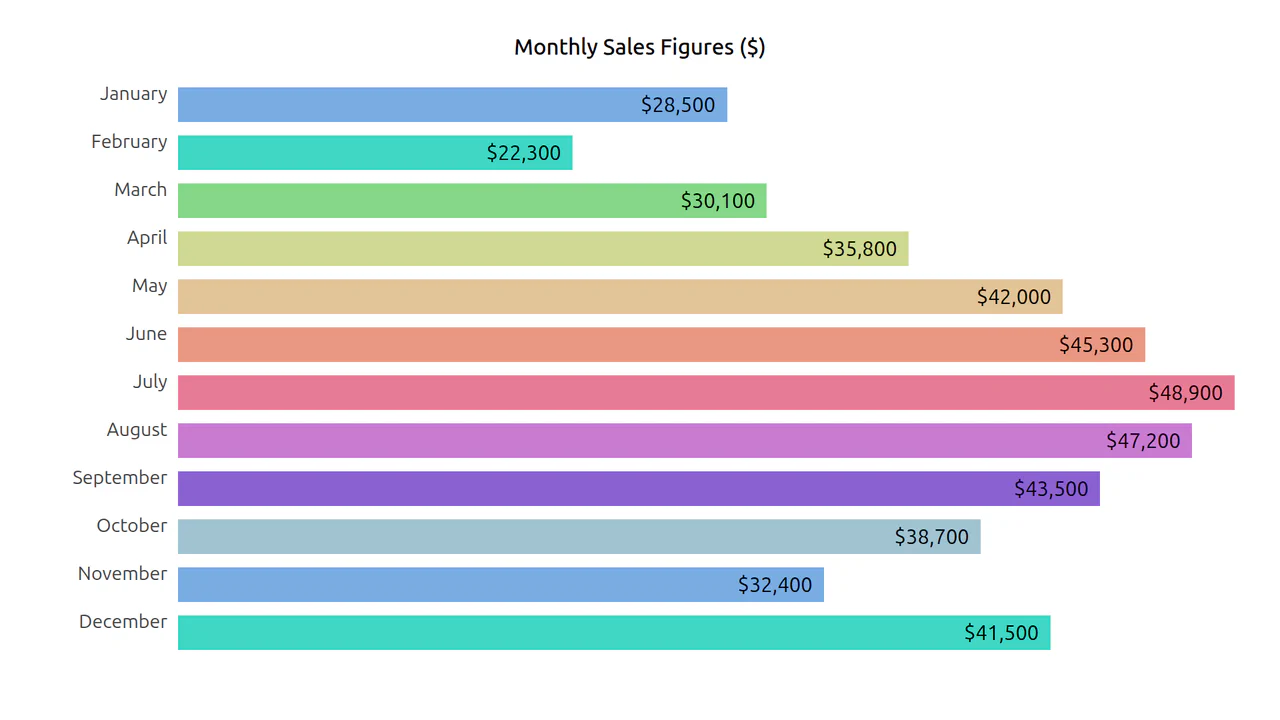
Semantic Grid Bar Chart
This is a Semantic Grid Bar Chart. It translates raw HTML data-* attributes directly into visual grid spans using bleeding-edge CSS functions. Its function is to render accessible data visualizations without relying on heavy JavaScript charting libraries or complex canvas setups.
See the Pen Semantic Grid Bar Chart.

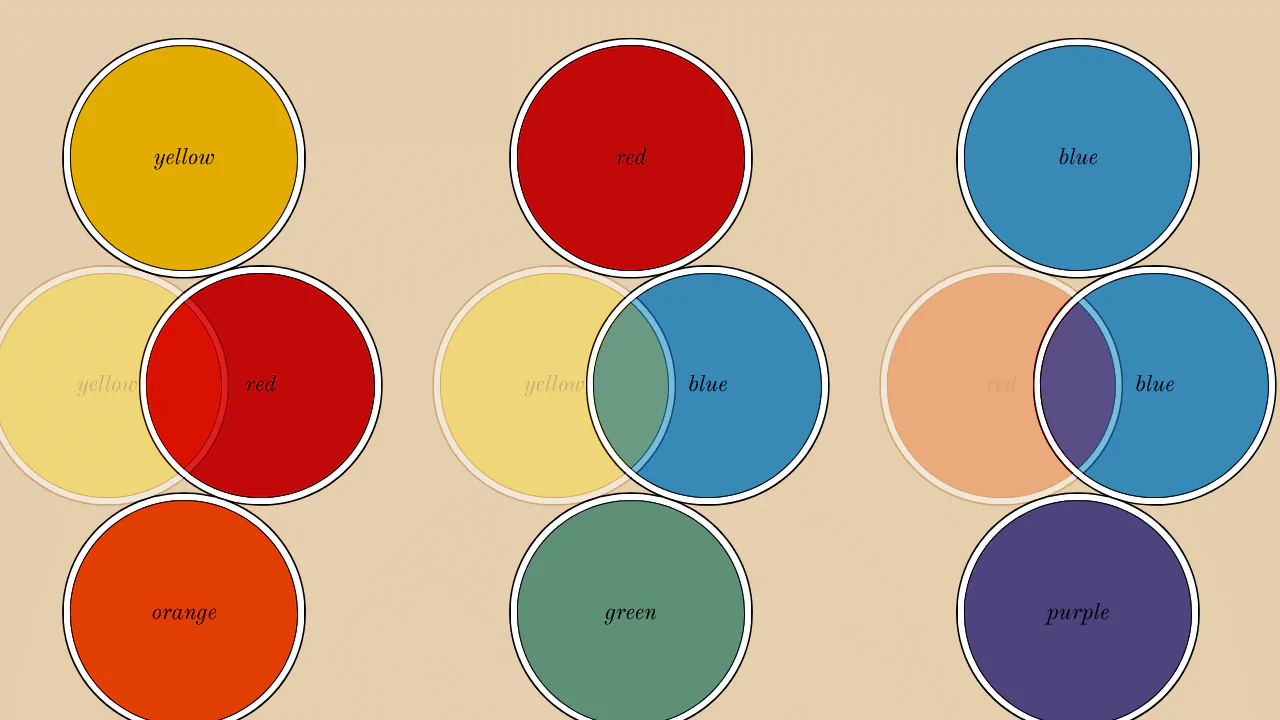
3D Rotating Value Dial
This is a 3D Rotating Value Dial. It visualizes continuous data through a spatial, cylindrical interface. Its function is to replace flat range indicators with a tactile, volumetric readout that dynamically shifts color hue based on value. (Requires: dat.gui)
See the Pen 3D Rotating Value Dial.
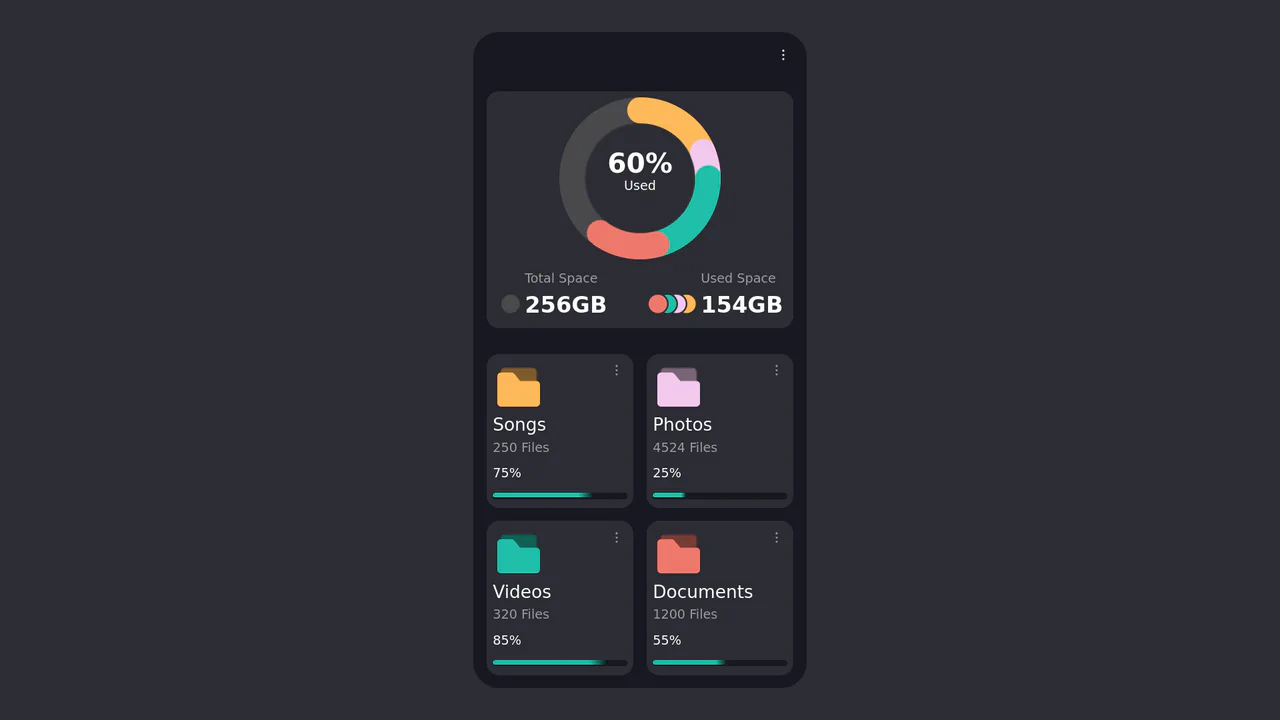
CSS Donut Chart for a File Manager UI
This component features a sophisticated donut chart created entirely with CSS, using a conic-gradient masked with a radial-gradient to create the arcs. The chart’s data is dynamically rendered from Pug variables into CSS Custom Properties, which then control the size and color of each segment.
See the Pen CSS Donut Chart for a File Manager UI.
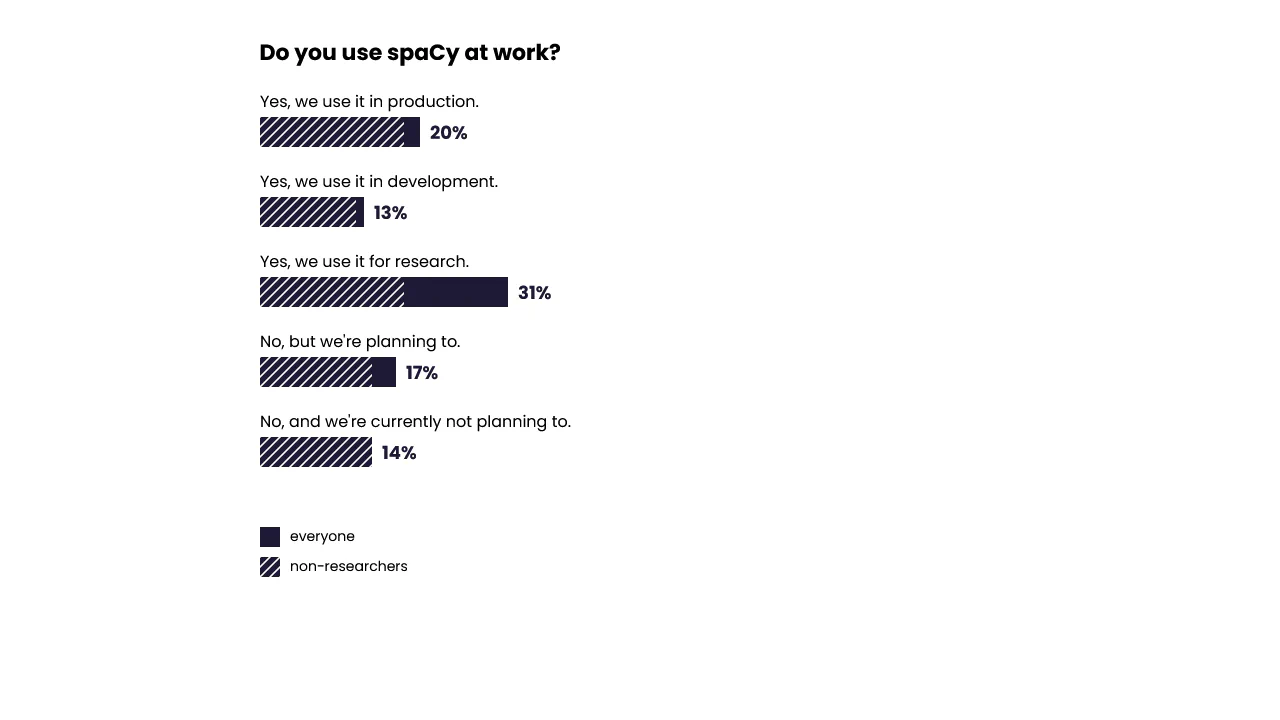
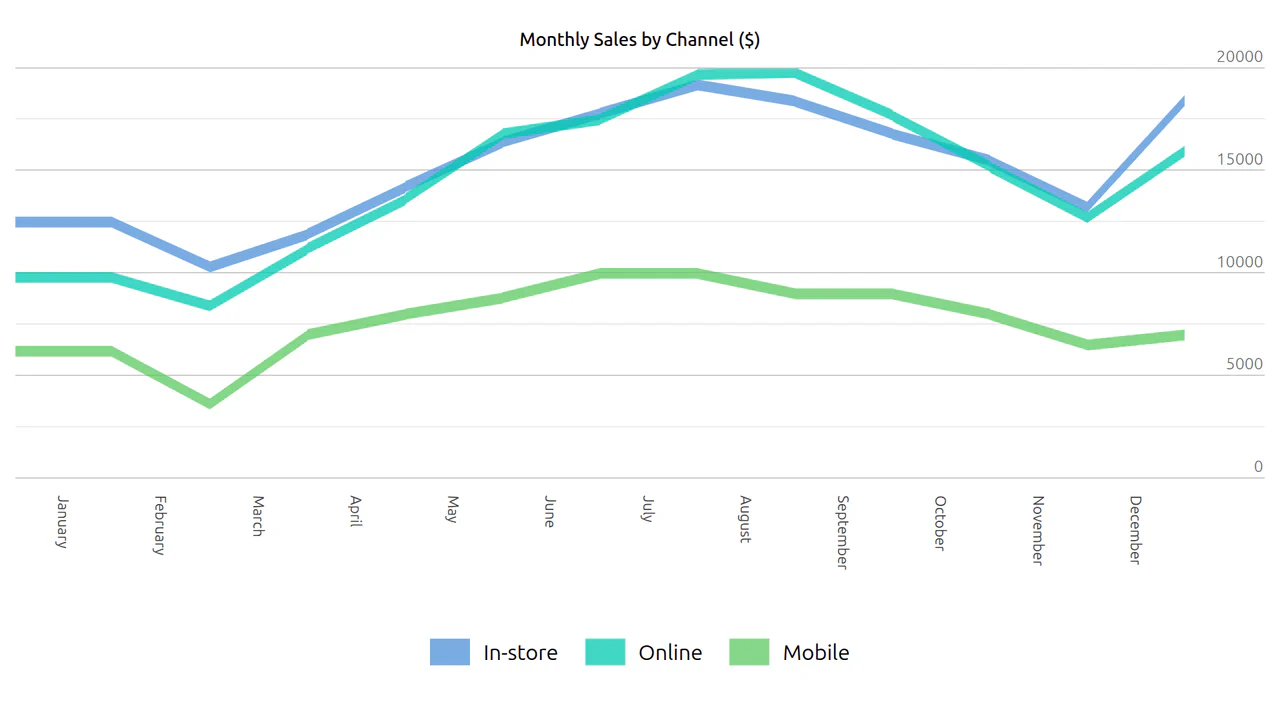
CSS Grouped Area Chart
A component that transforms a standard HTML data table into a visually clear area chart while preserving the semantic data structure for accessibility and SEO.
See the Pen CSS Grouped Area Chart.
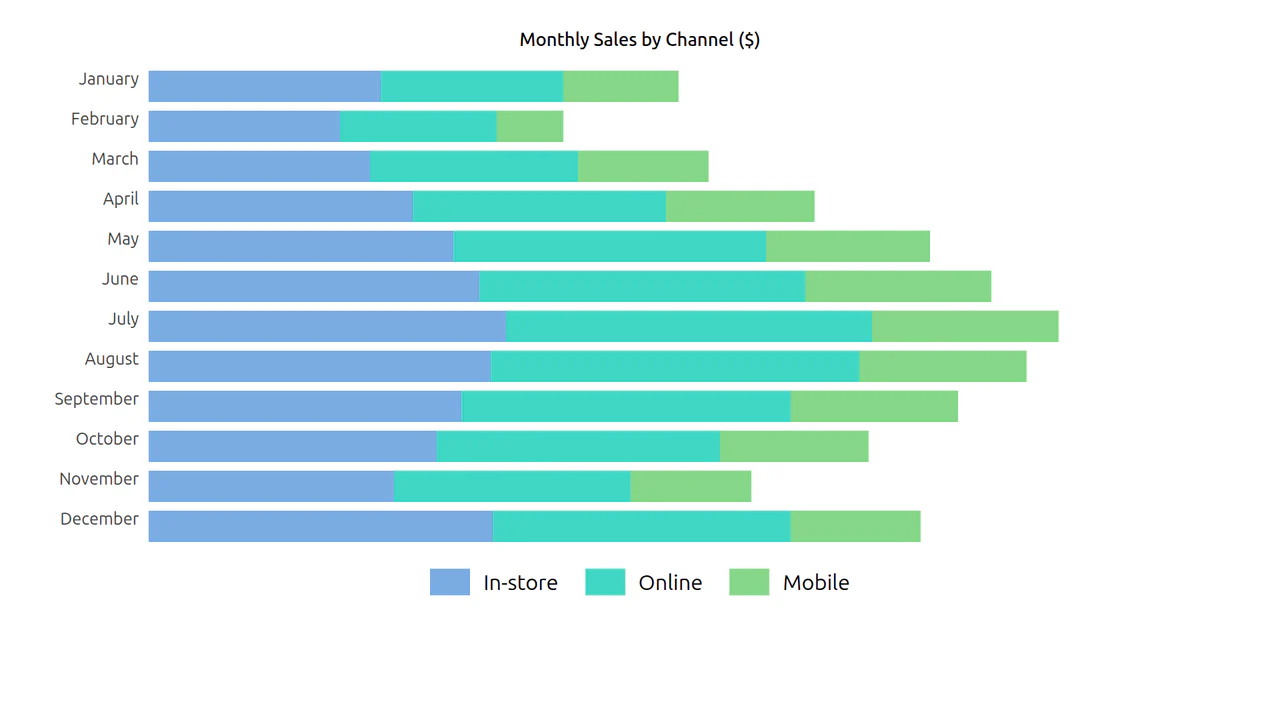
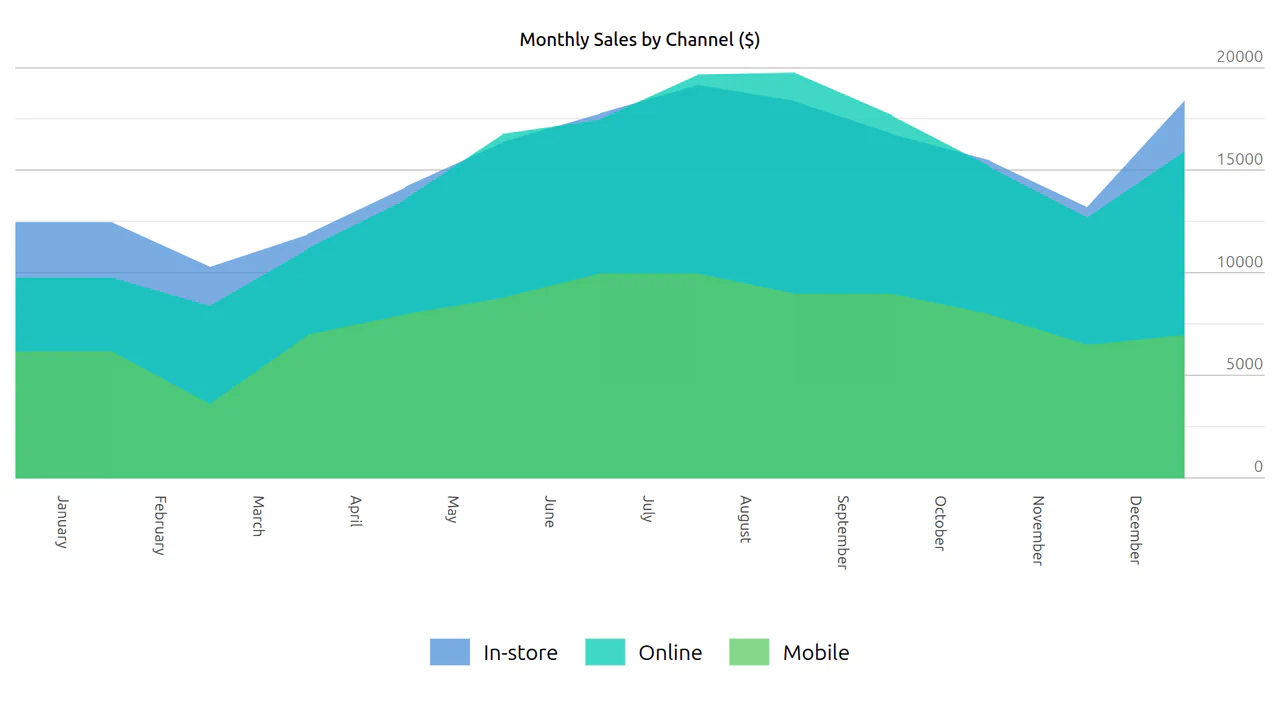
CSS Grouped Bar Chart
The data table transforms into a visual bar chart, allowing for easy comparison of sales by channel (In-store, Online, Mobile) across months.
See the Pen CSS Grouped Bar Chart.
Custom <data-chart> element embeds chart data directly in a table. Each cell carries data-v (value) and data-pv (previous value) attributes — the markup is structured, but rendering the actual chart depends on external CSS/JS. The legend and axis ticks are manually defined.
Custom <data-chart> element wraps a table that encodes monthly sales data. Each cell carries data-v, data-pv, and data-av attributes for plotting — the markup is semantic, accessible, and ready for CSS/JavaScript rendering.

SCSS generates donut slices via pseudo‑elements — each slice’s border colors create the wedge. Custom properties control proportions and optional spacing between slices. The result is a flexible, pure‑CSS donut chart with no JavaScript.
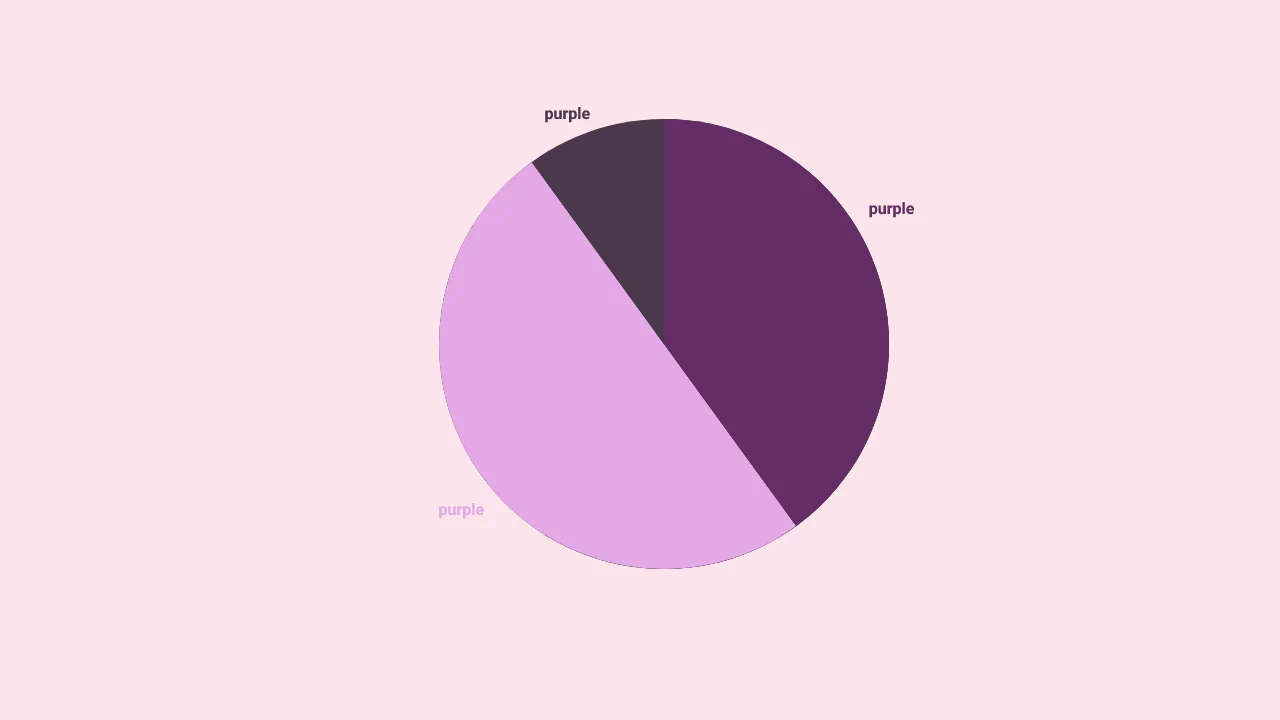
Single‑element pie chart using conic-gradient and mask — the hole is cut out via radial-gradient. The @property declaration allows the percentage to be animated. The pointer is a separate pseudo‑element rotated around the center; it appears only when rounding is enabled.
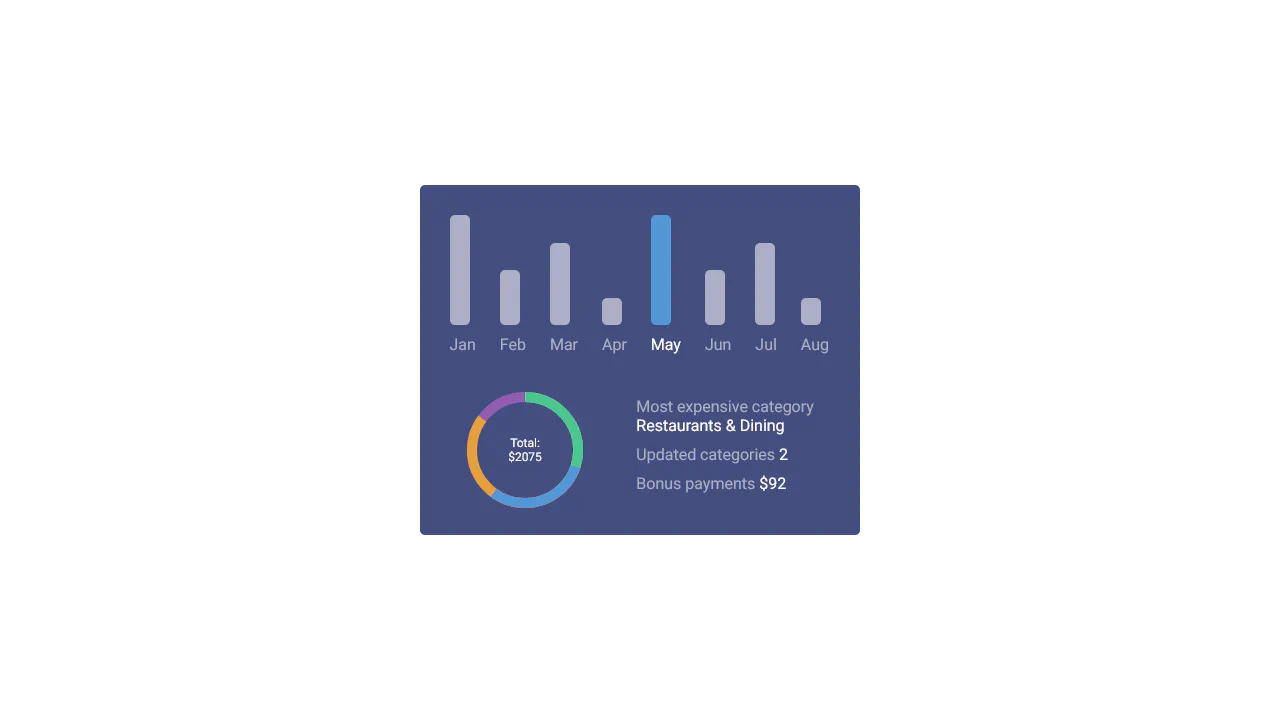
Monthly bar heights are set via fixed CSS classes, making the chart non‑dynamic. The donut chart uses four SVG paths with manually adjusted stroke‑dasharray values. Hover highlights the selected month and reveals a custom scrollbar for the year view.

An area chart built with HTML and CSS only — each cell’s clip-path creates a vertical segment based on custom properties. Rows represent data points, columns represent different series; colors are assigned via nth‑of‑type. The markup is unconventional but functional for static visualizations.
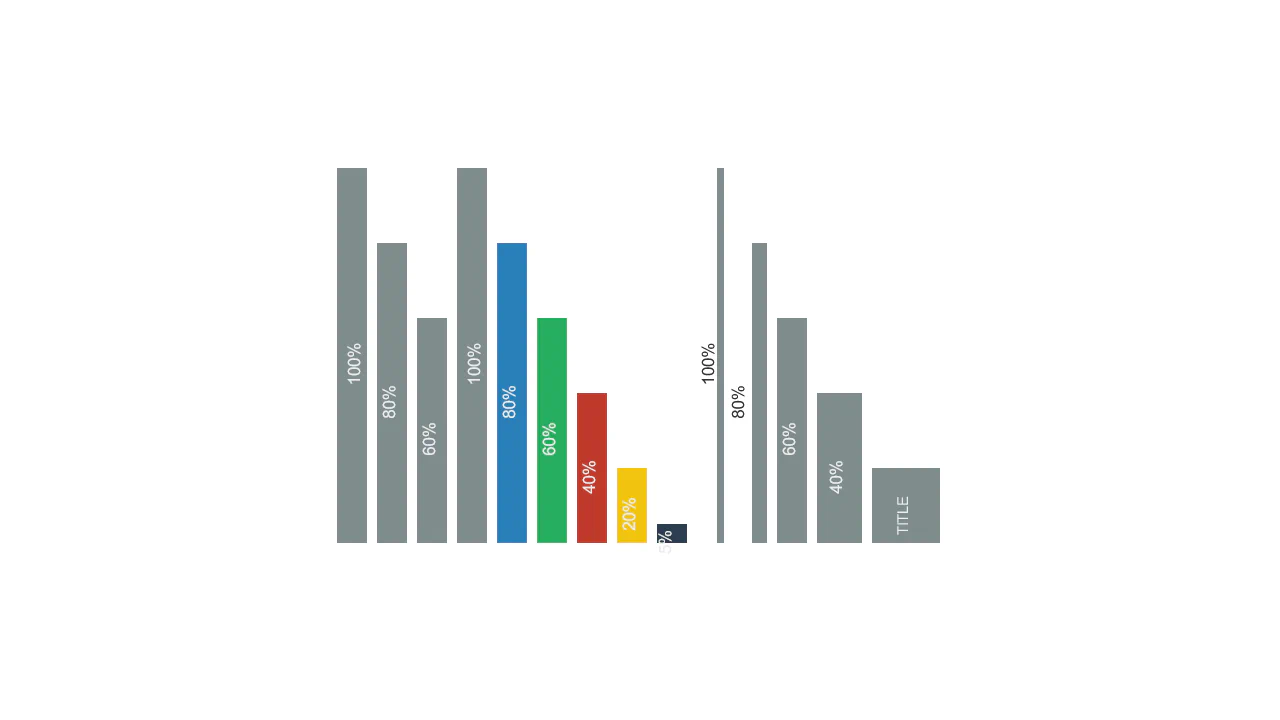
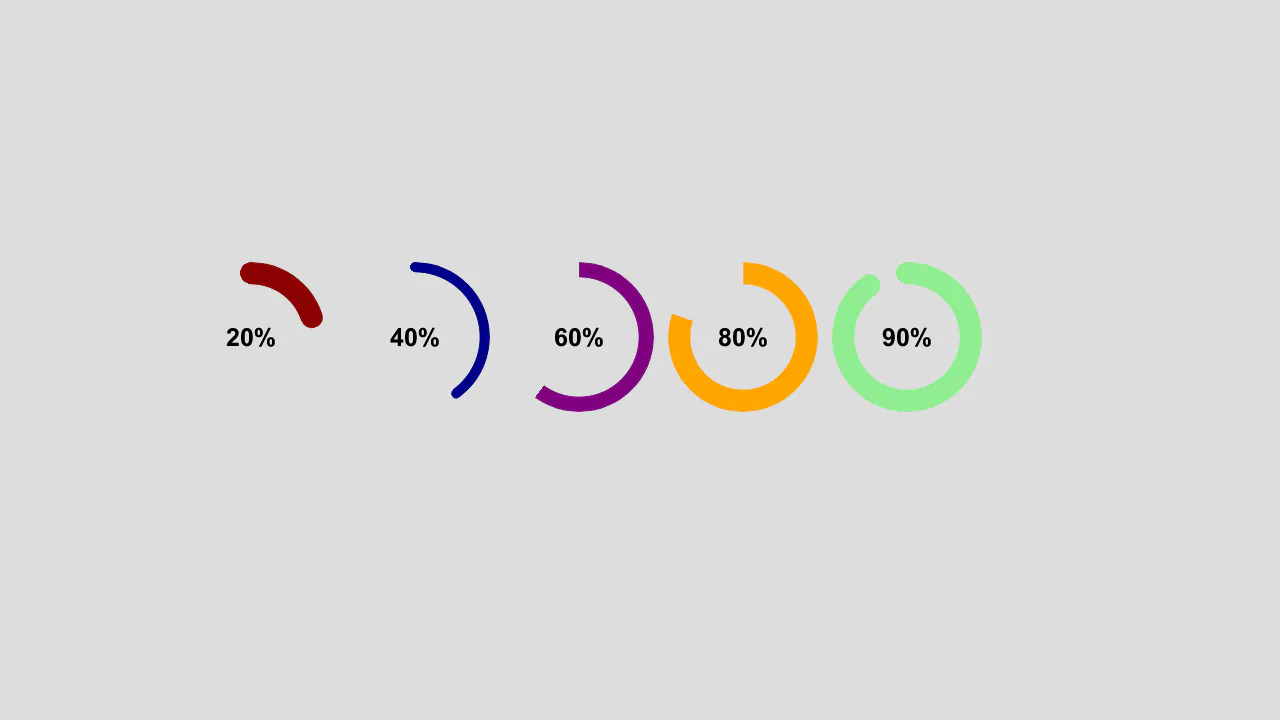
A radial skills chart built with pure CSS — @property animates integer values, clip‑path shapes each arc, and transforms arrange them radially. The animations are sequenced to reveal the disc, labels, and counters in stages, all without JavaScript.
A donut chart built with a single element — conic-gradient fills the arc, while a mask cuts out the center. The --ng custom property controls the sweep angle, making it easy to update with a slider. The snippet is pure CSS; the slider and any interactivity would require JavaScript.
Animated circular progress bars built with conic-gradient and a masking technique — the fill is driven by a custom property animated via @property. The visible percentage is rendered with a CSS counter on a pseudo‑element. A native <progress> element is present for semantics but hidden.
A minimalist bar chart built with CSS Grid — bar height is controlled by the --val custom property. Background lines are drawn with repeating-linear-gradient on a pseudo‑element. Each bar animates in height on load; labels and values are absolutely positioned inside.