5 D3.js Examples
Explore the essential capabilities of D3.js (Data-Driven Documents) for powerful data binding and manipulation of the DOM. This collection demonstrates how to leverage the library’s key features, such as the data join pattern, to efficiently render and update thousands of elements, primarily using SVG and Canvas. Focus is placed on creating custom visualizations, from complex graphs to geographical maps, by mapping raw data directly to visual attributes.
Examples

Animated D3.js Pie Chart with Elastic Easing
This dynamic D3.js pie chart utilizes a custom elastic easing and a rotate transform for the spectacular “spin-in” animation of each slice.
See the Pen Animated D3.js Pie Chart with Elastic Easing.

Animated Periodic Table
This interactive demo uses pure JavaScript and D3.js to generate and animate a full Periodic Table via SVG, showcasing advanced techniques for data-driven element positioning and cyclical motion effects.
See the Pen Animated Periodic Table.
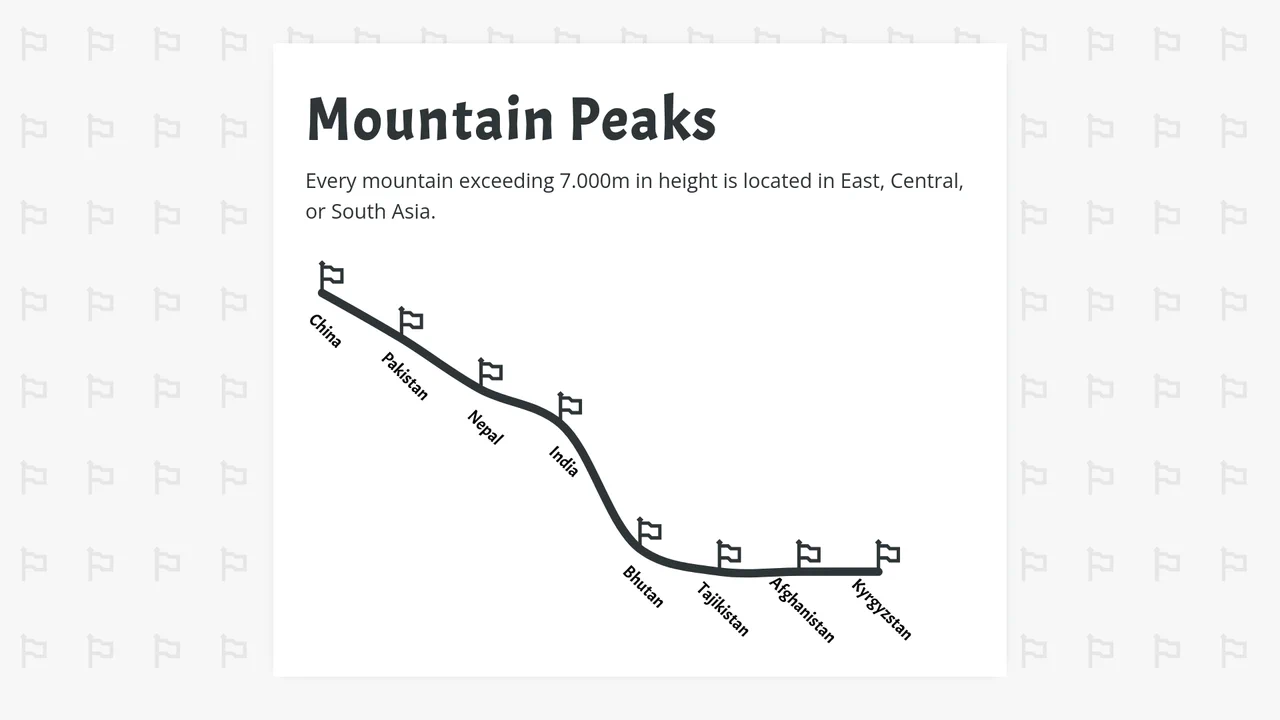
D3 Line Marker Chart
A powerful D3.js line chart dynamically visualizes data aggregated from a nested JavaScript object, showcasing the use of reduce for data processing and scaleBand with scaleLinear for precise axis scaling.
See the Pen D3 Line Marker Chart.
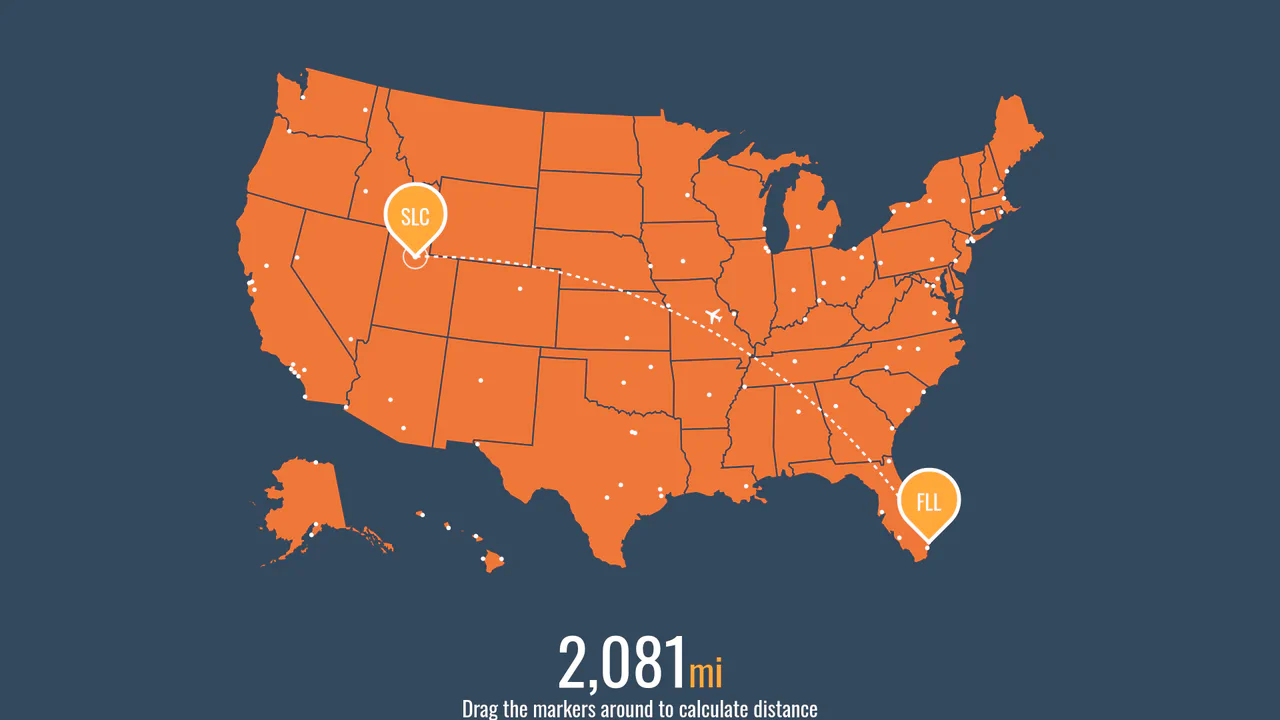
Airport Distance Map with Vue, D3 and GSAP
This demo integrates Vue.js reactivity with D3.js for map projection and rendering, using GSAP’s MorphSVGPlugin to draw and animate a dynamic flight path. It calculates the real-world distance between two draggable markers based on geodesic coordinates.
See the Pen Airport Distance Map with Vue, D3 and GSAP.

React Range Slider with D3 Tick Marks
A technical focus: utilizing D3.js to create a custom time axis and rendering it within SVG, where the React component solely provides the slider interface and dynamically updates the year value via setState.
See the Pen React Range Slider with D3 Tick Marks.