10+ React Data Visualization Examples
In collections of React Data Visualization examples, the main focus is on flexibility and customization. They demonstrate how to use SVG or HTML5 Canvas to build charts from scratch, giving full control over the appearance. Important features they highlight include: managing animation for data changes, event handling (e.g., clicks on chart sectors), and using data-related hooks (e.g., useMemo for computation optimization) to ensure a smooth UX.
Examples
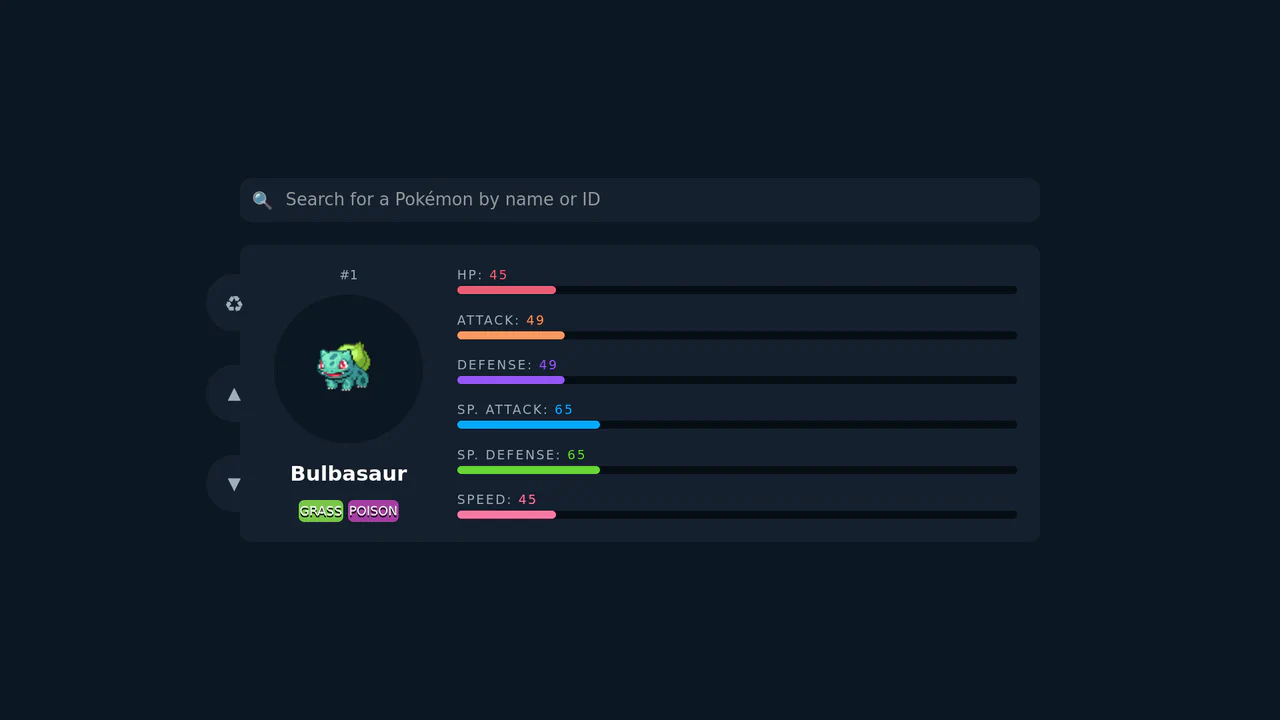
Animated Pokemon Data Dashboard
This is an Animated Pokemon Data Dashboard. It interfaces with the PokéAPI to display character statistics using fluid, color-coded progress bars and dynamic badges. Its function is to transform raw JSON data into an engaging, highly visual interface, demonstrating effective state management and asynchronous rendering in React. (Requires: react.js, react-dom.js, gsap.js, axios.js)
See the Pen Animated Pokemon Data Dashboard.

Odometer Number Counter
This is an Odometer Number Counter. It visualizes numerical changes (such as MRR, follower counts, or revenue) using a mechanical rolling effect. Its function is to provide a highly configurable, tactile alternative to instant number swapping, bringing physical momentum to digital dashboards. (Requires: React, ReactDOM, dat.gui)
See the Pen Odometer Number Counter.

Pure CSS Isometric Floating Layers Diagram
This Isometric Floating Layers Diagram is a visually striking React component designed to represent architectural stacks or multi-tiered systems. By combining SVG geometry with CSS animations, it creates a lightweight 3D isometric illusion. Each layer floats rhythmically, enhanced by vibrant gradients and drop shadows, making it perfect for landing pages explaining software infrastructure or service tiers. (Requires: react, react-dom)
See the Pen Pure CSS Isometric Floating Layers Diagram.

Flat Sales Dashboard UI
Interactive sales dashboard built with React using pure ES modules and no build step. Features dynamic SVG charts, leverages Intl.API for data formatting, and uses Tailwind CSS for a responsive layout with dark mode support.
See the Pen Flat Sales Dashboard UI.

GitHub Stargazers Counter (React)
A customizable React component that fetches live GitHub star counts via the API hook useEffect. It features a smooth loading transition: a spinning star icon expands into a count badge using CSS max-width and transform animations upon data retrieval, supported by SCSS-based light/dark theming.
See the Pen GitHub Stargazers Counter (React).

Fitness Stat Animations with React
A highly animated React component for fitness statistics, featuring performant number counting and circular progress bars driven by requestAnimationFrame and a custom easeInOutCubic easing function, ensuring smooth, non-CSS transitions.
See the Pen Fitness Stat Animations with React.

Precipitation-Focused Weather Widget
A slick React + TypeScript weather widget featuring custom, animated SVG ring graphs to visualize precipitation chances, employing useEffect for smooth initial load animation and robust utility class methods for unit conversion.
See the Pen Precipitation-Focused Weather Widget.
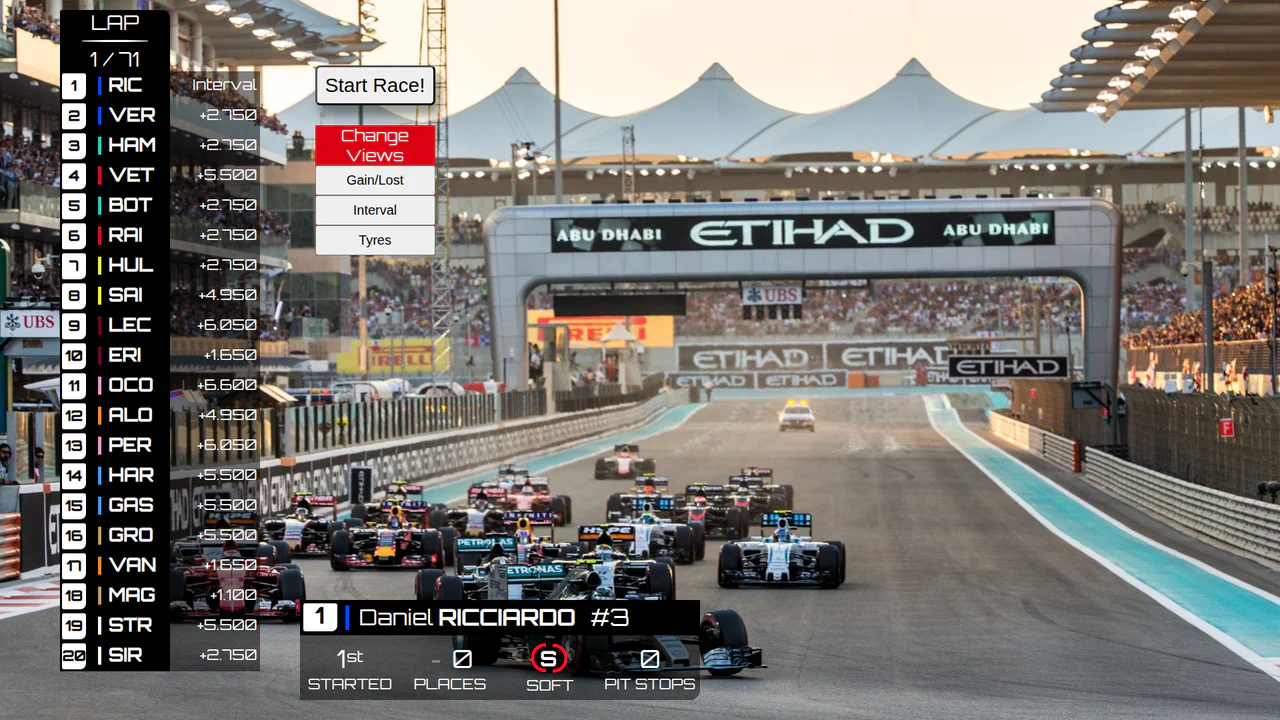
F1 Leaderboard UI with Framer Motion
An interactive F1 dashboard, built with React, that simulates a race in real-time, updating driver positions using dynamic sorting and smoothly animating changes with Framer Motion.
See the Pen F1 Leaderboard UI with Framer Motion.
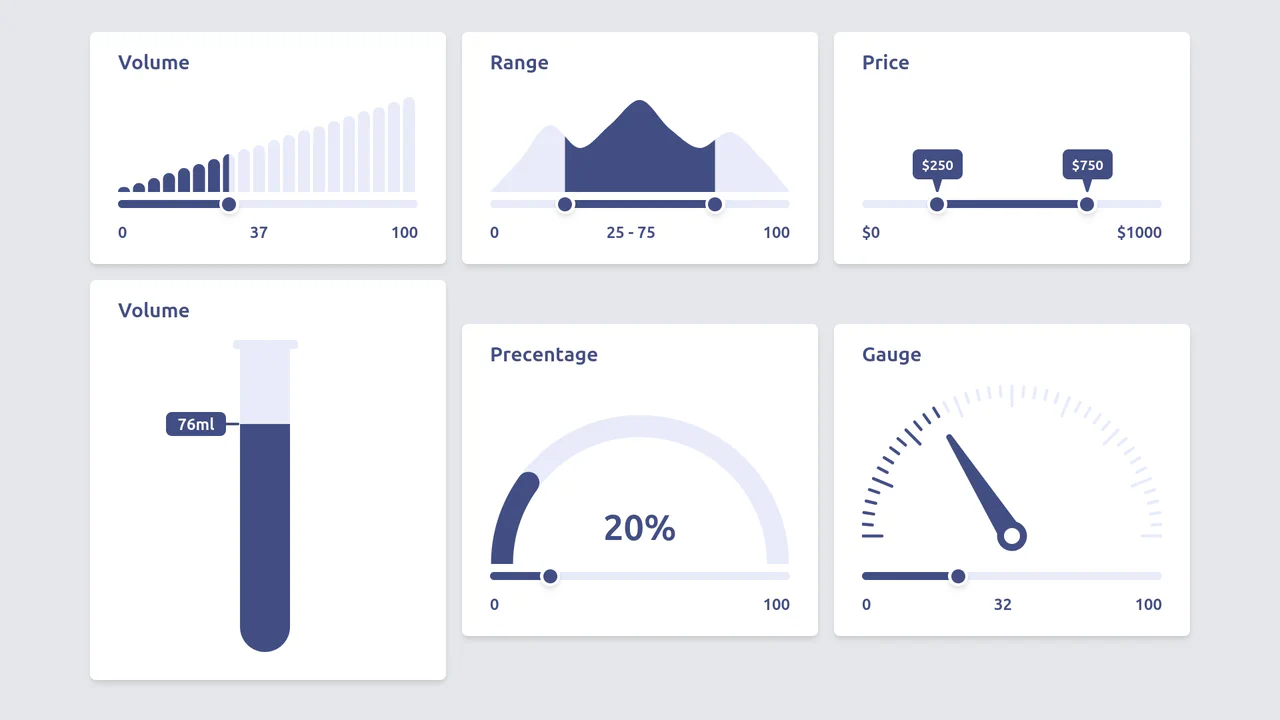
Diverse Custom Range Sliders in React with SVG and Tailwind
A showcase of diverse, custom range input styling achieved by hiding the native thumb and track, and then overlaying React/Tailwind elements and SVG graphics controlled by the component’s state.
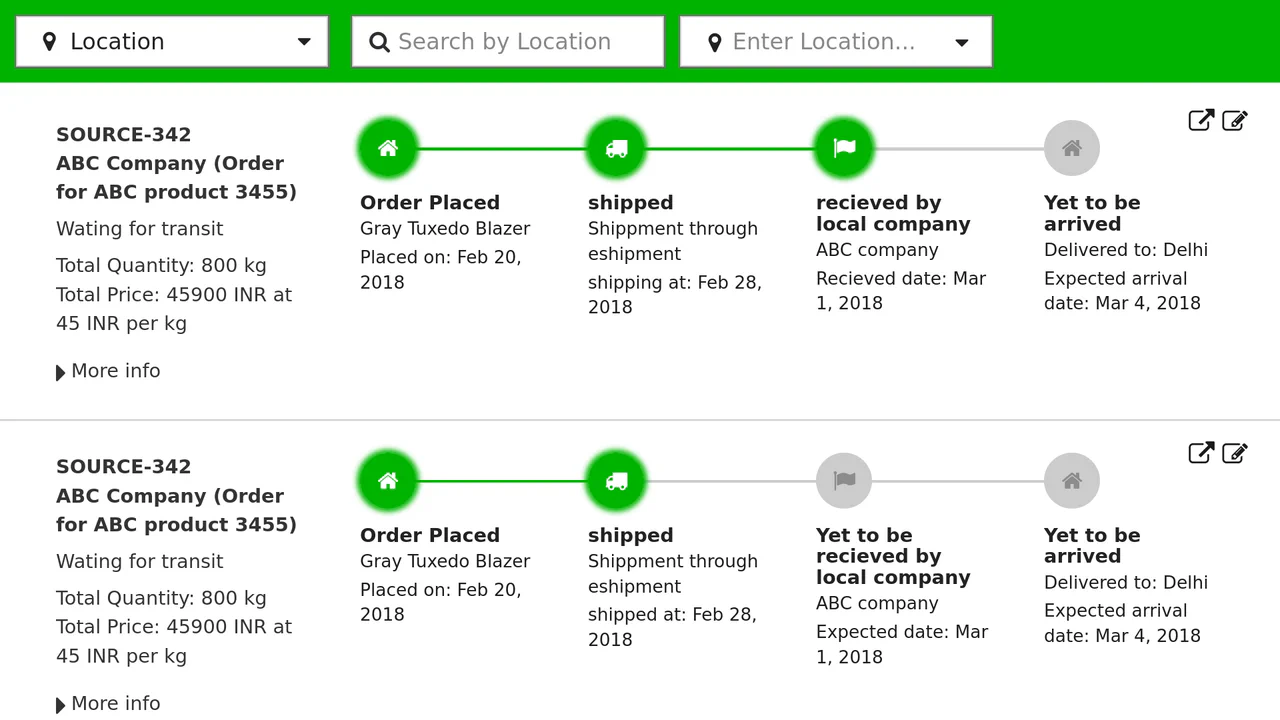
Responsive React Timeline Implementation
A robust React implementation of a data-driven, responsive timeline perfect for order tracking.
See the Pen Responsive React Timeline Implementation.

Star Wars: The Characters' Interactive Timeline
It uses React Hooks for data fetching and detail management, alongside dynamic styling to render a large, horizontally scrollable timeline with character points.
See the Pen Star Wars: The Characters' Interactive Timeline.

React Range Slider with D3 Tick Marks
A technical focus: utilizing D3.js to create a custom time axis and rendering it within SVG, where the React component solely provides the slider interface and dynamically updates the year value via setState.
See the Pen React Range Slider with D3 Tick Marks.