10+ Tailwind Charts and Graphs
This collection is a toolkit for creating responsive and interactive data visualizations with Tailwind CSS. A utility-first approach is used for the rapid development of bar charts with Flexbox and inline SVG graphs styled with currentColor for easy theming. Dynamism is added through smooth transition animations and interactive tooltips on group-hover. CSS variables allow for precise value setting, creating performant and beautiful charts without heavy JS libraries.
Examples
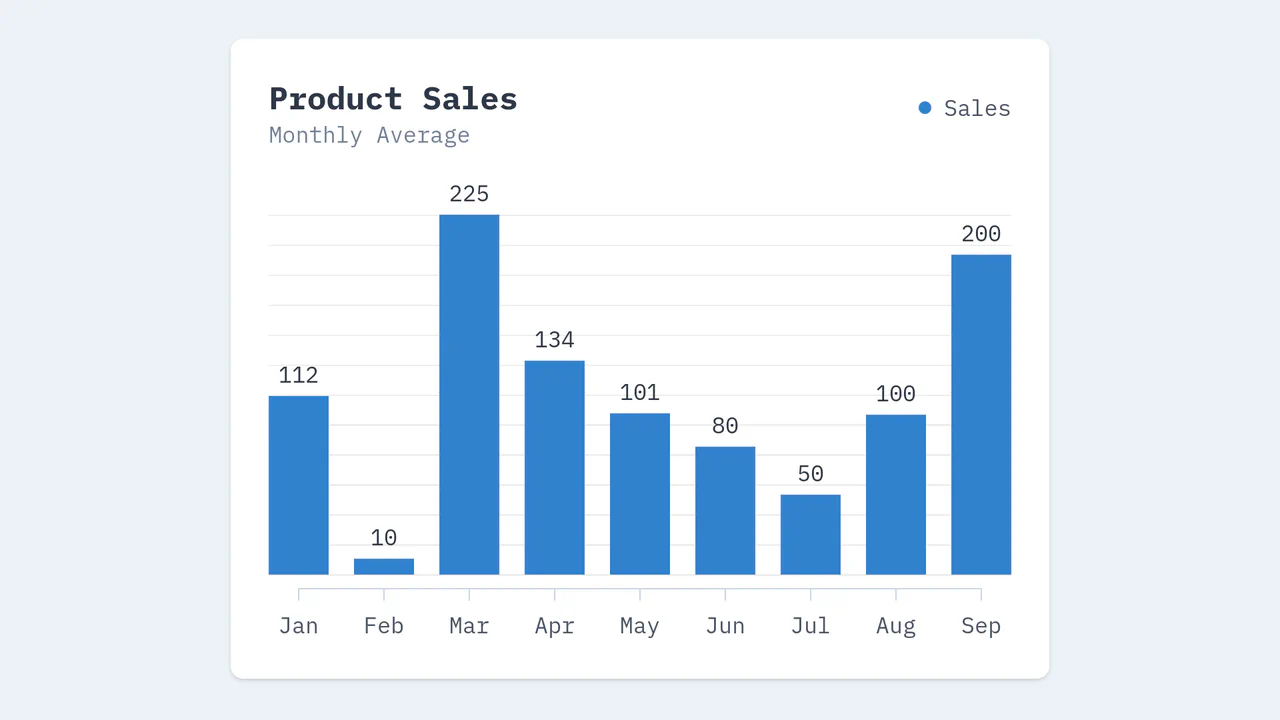
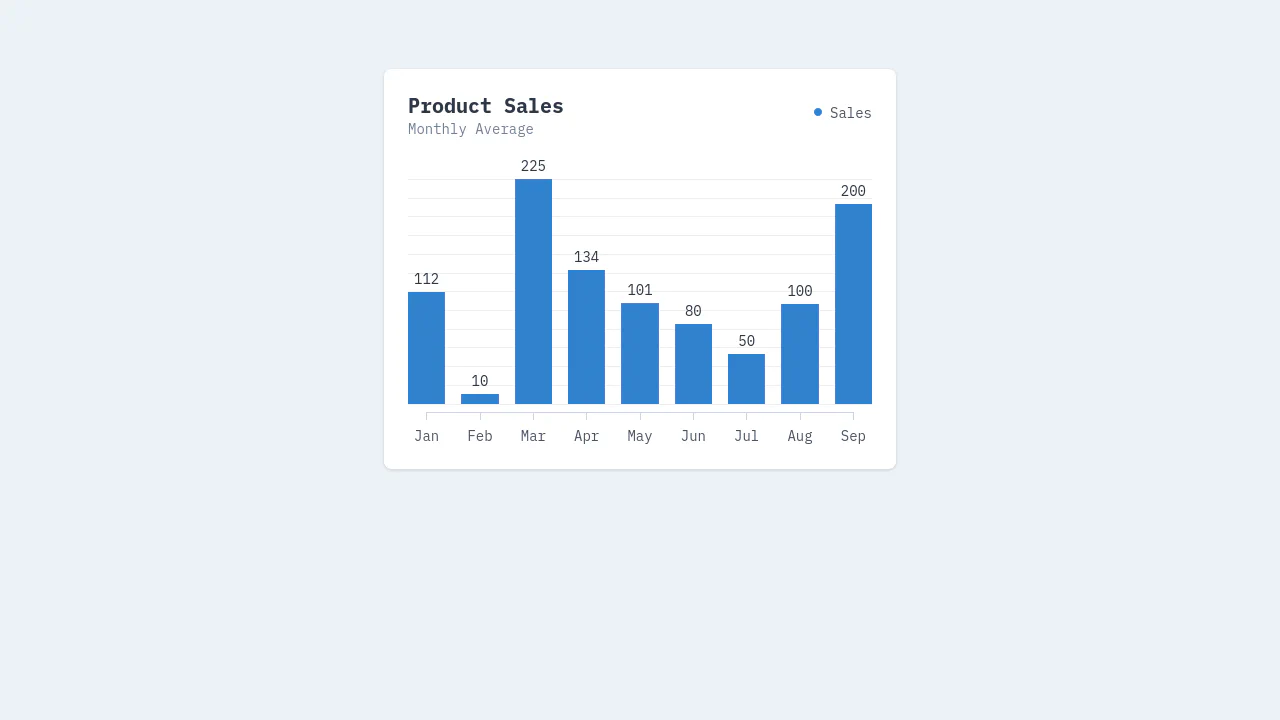
Simple Alpine.js Bar Chart
This Simple Alpine.js Bar Chart offers a minimalist alternative to heavyweight libraries like Chart.js or D3. By leveraging Alpine.js for reactivity and Tailwind CSS for styling, it renders a functional, interactive bar chart with a tiny footprint. It is ideal for dashboards where bundle size is a priority and complex charting features aren’t required. (Requires: Alpine.js, Tailwind CSS)
 Chrome 80+
 Edge 80+
 Safari 14+
 Firefox 78+
See the Pen Simple Alpine.js Bar Chart.
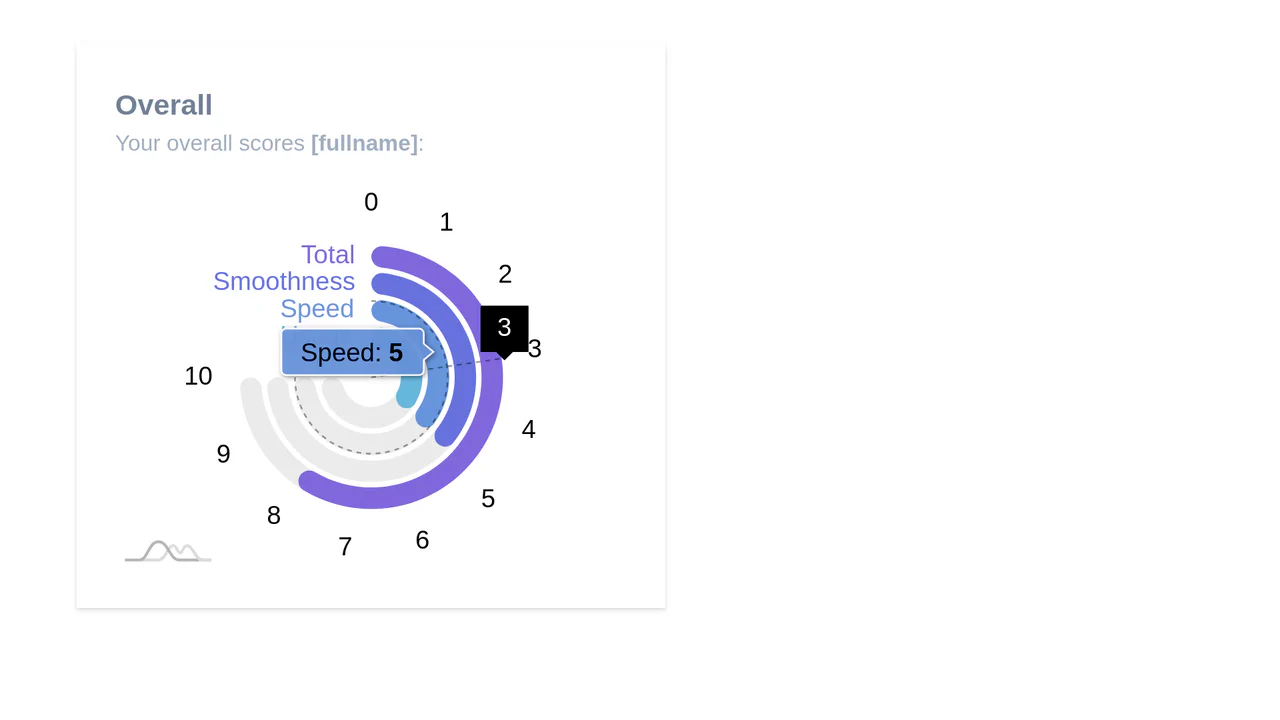
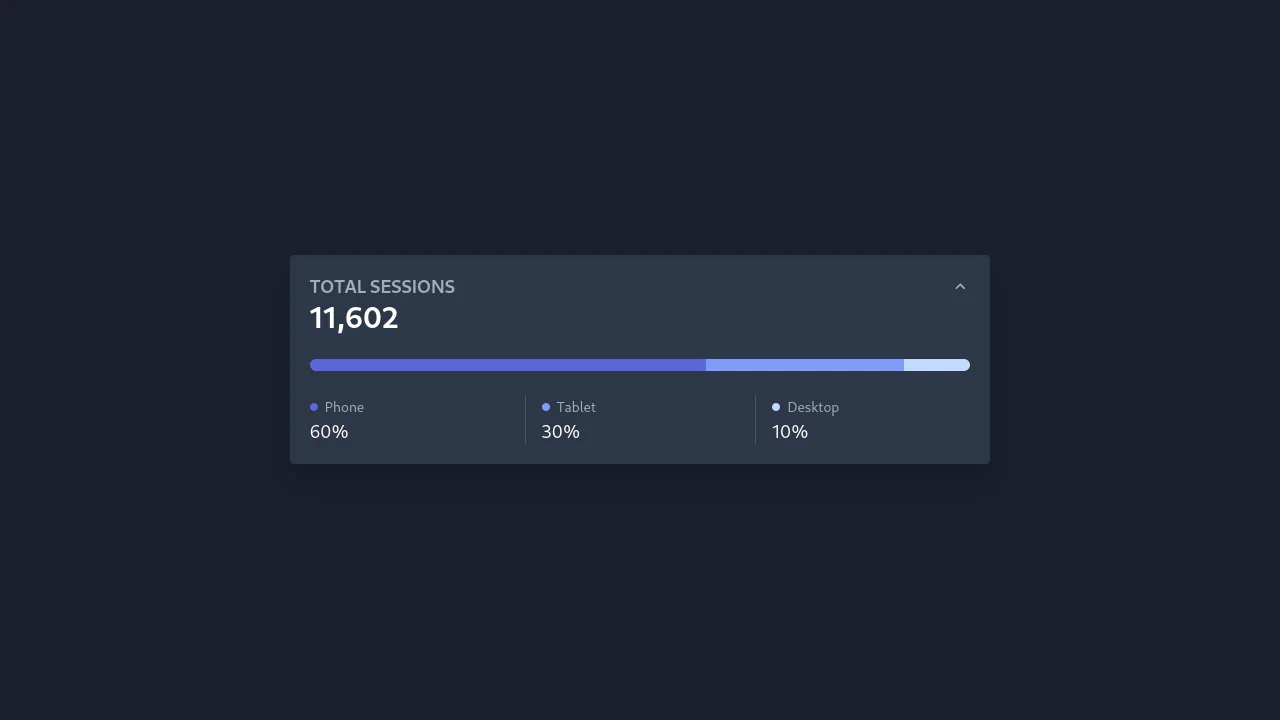
Alpine.js and Tailwind Radial Chart
A visually engaging radial bar chart widget created with amCharts 4 and styled within a Tailwind CSS card container.
See the Pen Alpine.js and Tailwind Radial Chart.
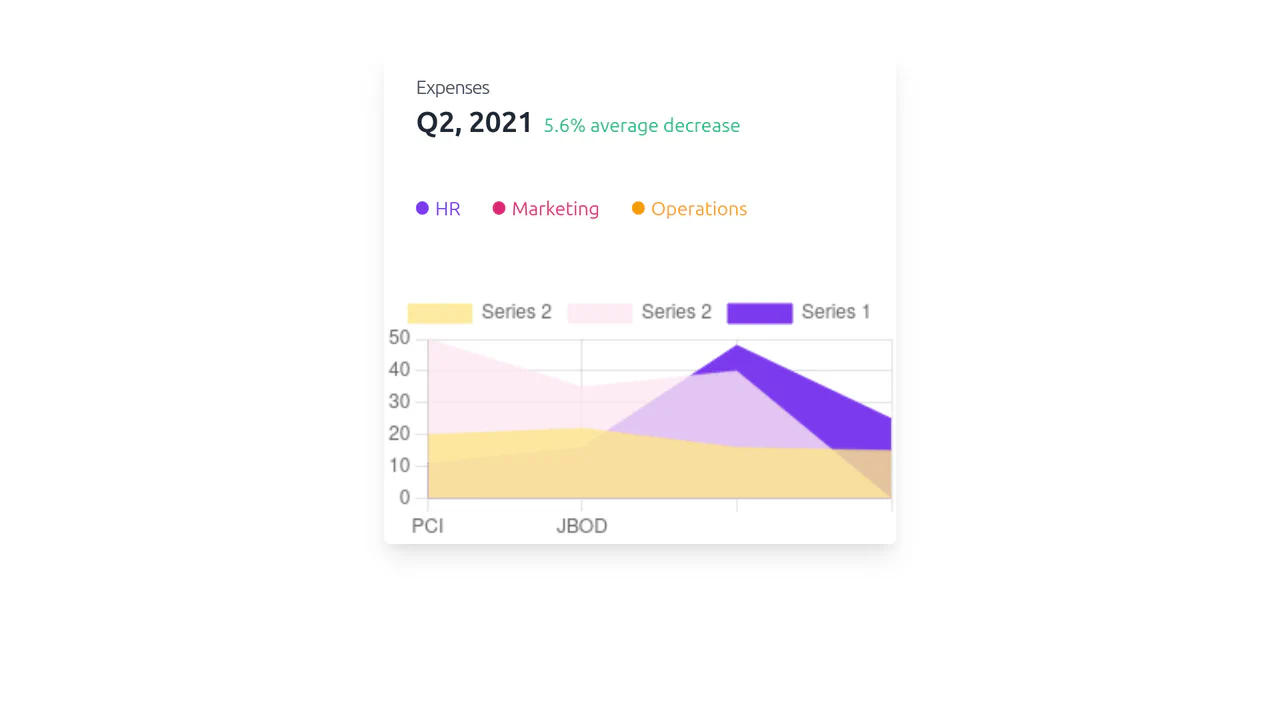
Card Graph with Tailwind
A compact dashboard widget featuring a stacked area chart rendered by Chart.js to visualize expenses across different departments. Styled with Tailwind CSS, the card includes a custom legend and a clean header.
See the Pen Card Graph with Tailwind.

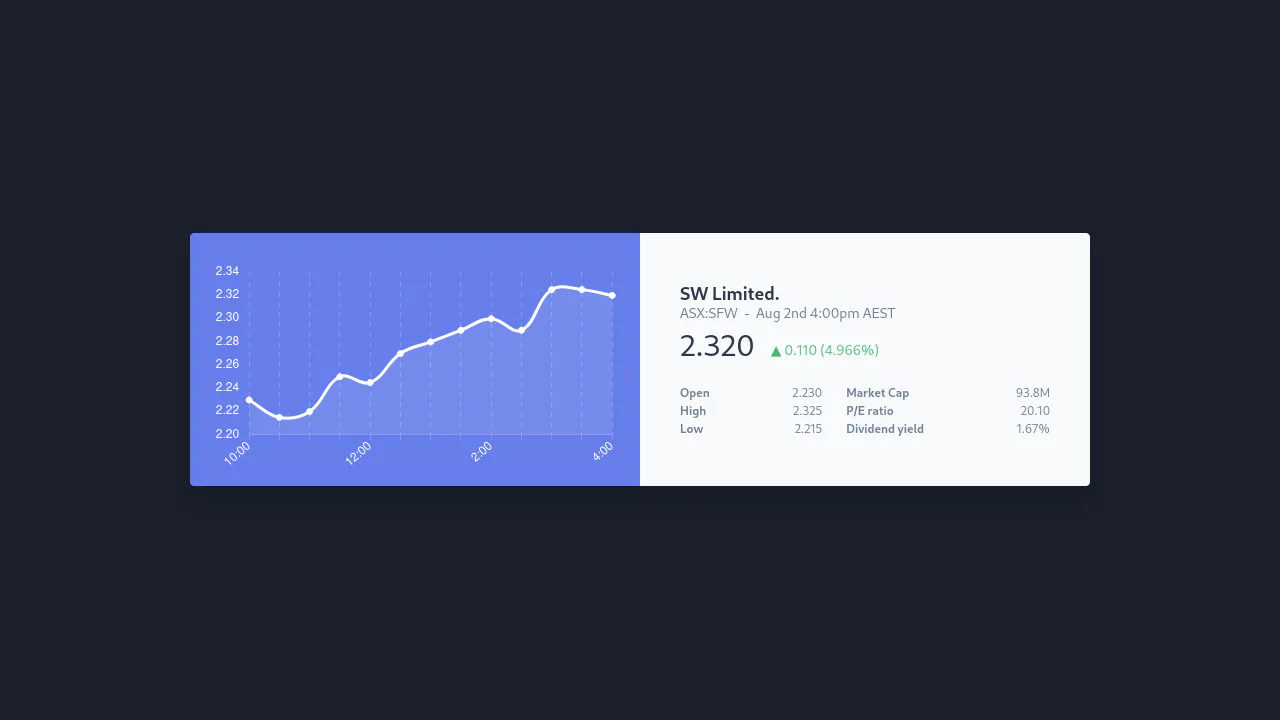
Free Tailwind CSS Graph Component
A sales overview dashboard widget featuring a line graph rendered by the Chart.js library. It includes interactive controls like toggle buttons and a dropdown for data filtering, all styled with Tailwind CSS.
See the Pen Free Tailwind CSS Graph Component.

Tailwind CSS Charts
A versatile dashboard component showcasing ten distinct chart types powered by ApexCharts, ranging from line and area graphs to complex mixed and radial charts.
See the Pen Tailwind CSS Charts.

Testing Charts with Apex and Tailwind
An analytical dashboard card for FRC robotics teams, styled with Tailwind CSS and Flowbite. It features a multi-series line chart powered by ApexCharts to track match performance metrics (End Game, Defenses, Boulder) alongside key statistics.
See the Pen Testing Charts with Apex and Tailwind.
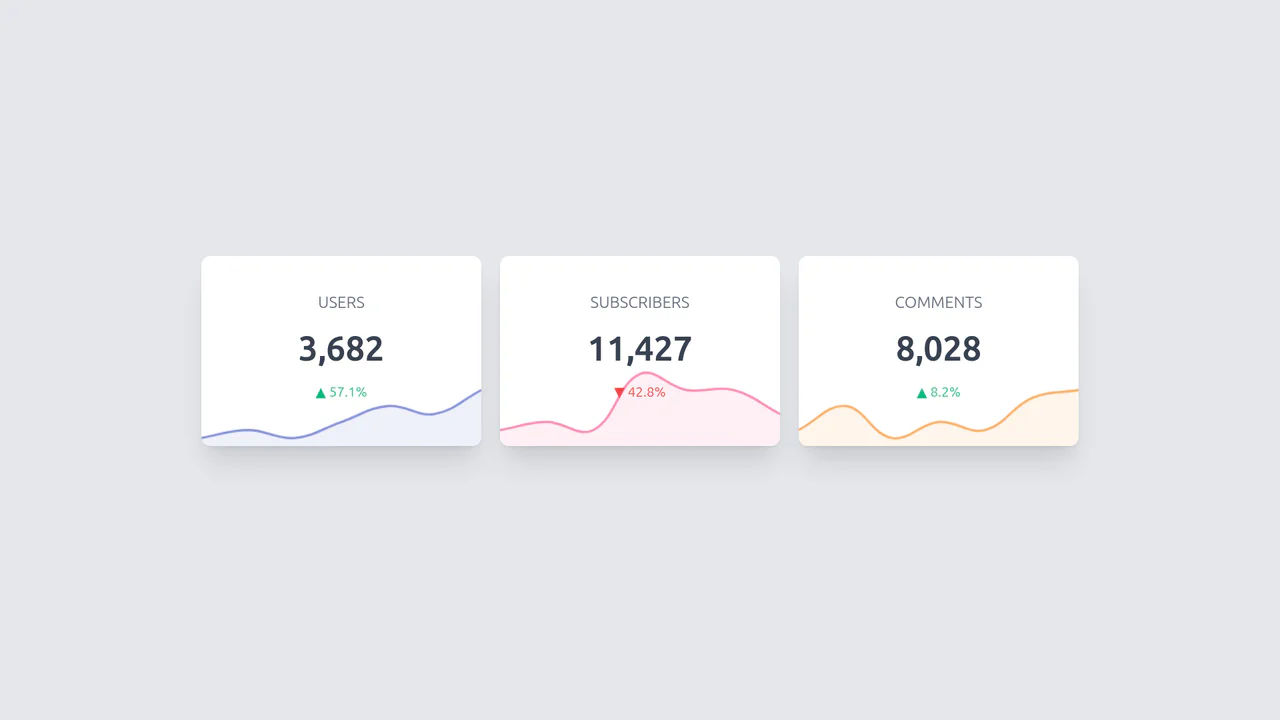
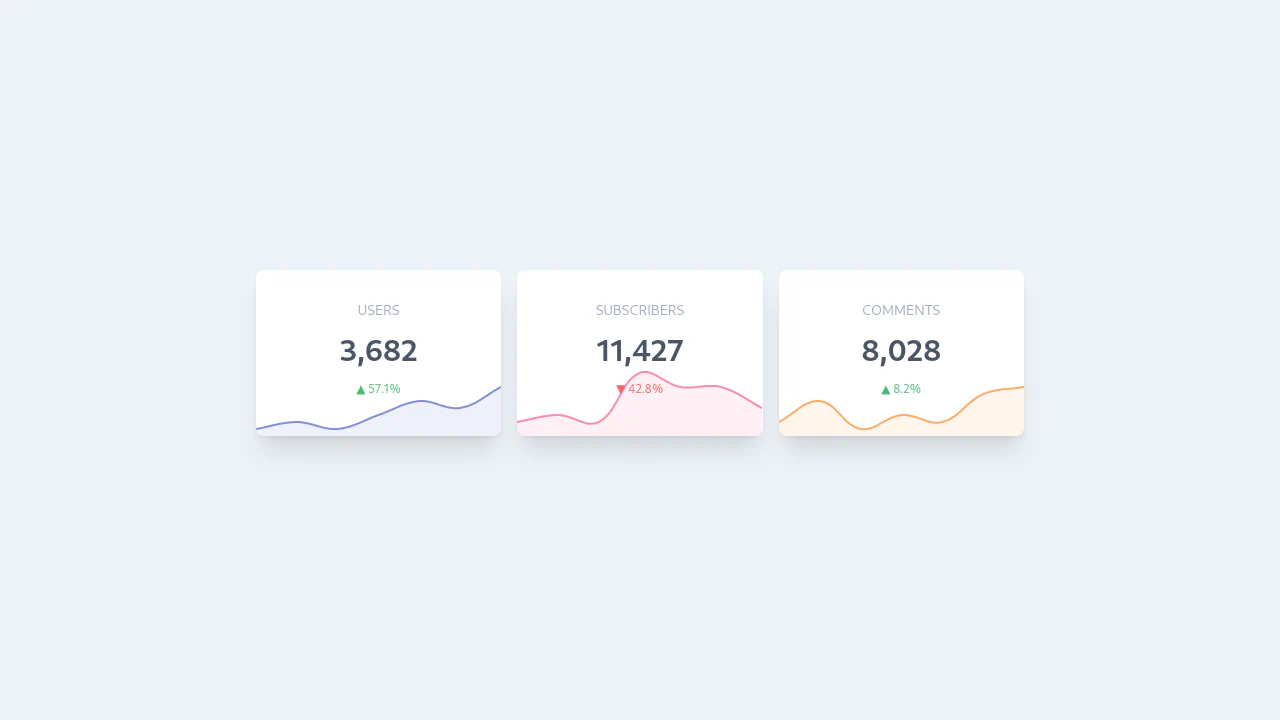
Tailwind Cards with Charts
Ready-to-use, responsive KPI cards built with Tailwind CSS. Each card integrates a dynamic mini-chart (sparkline), created using the Chart.js library, for clear visualization of key metrics.
See the Pen Tailwind Cards with Charts.